Hawaiian vs Irish No Vehicles in Household
COMPARE
Hawaiian
Irish
No Vehicles in Household
No Vehicles in Household Comparison
Hawaiians
Irish
8.0%
NO VEHICLES IN HOUSEHOLD
99.9/ 100
METRIC RATING
52nd/ 347
METRIC RANK
7.4%
NO VEHICLES IN HOUSEHOLD
100.0/ 100
METRIC RATING
22nd/ 347
METRIC RANK
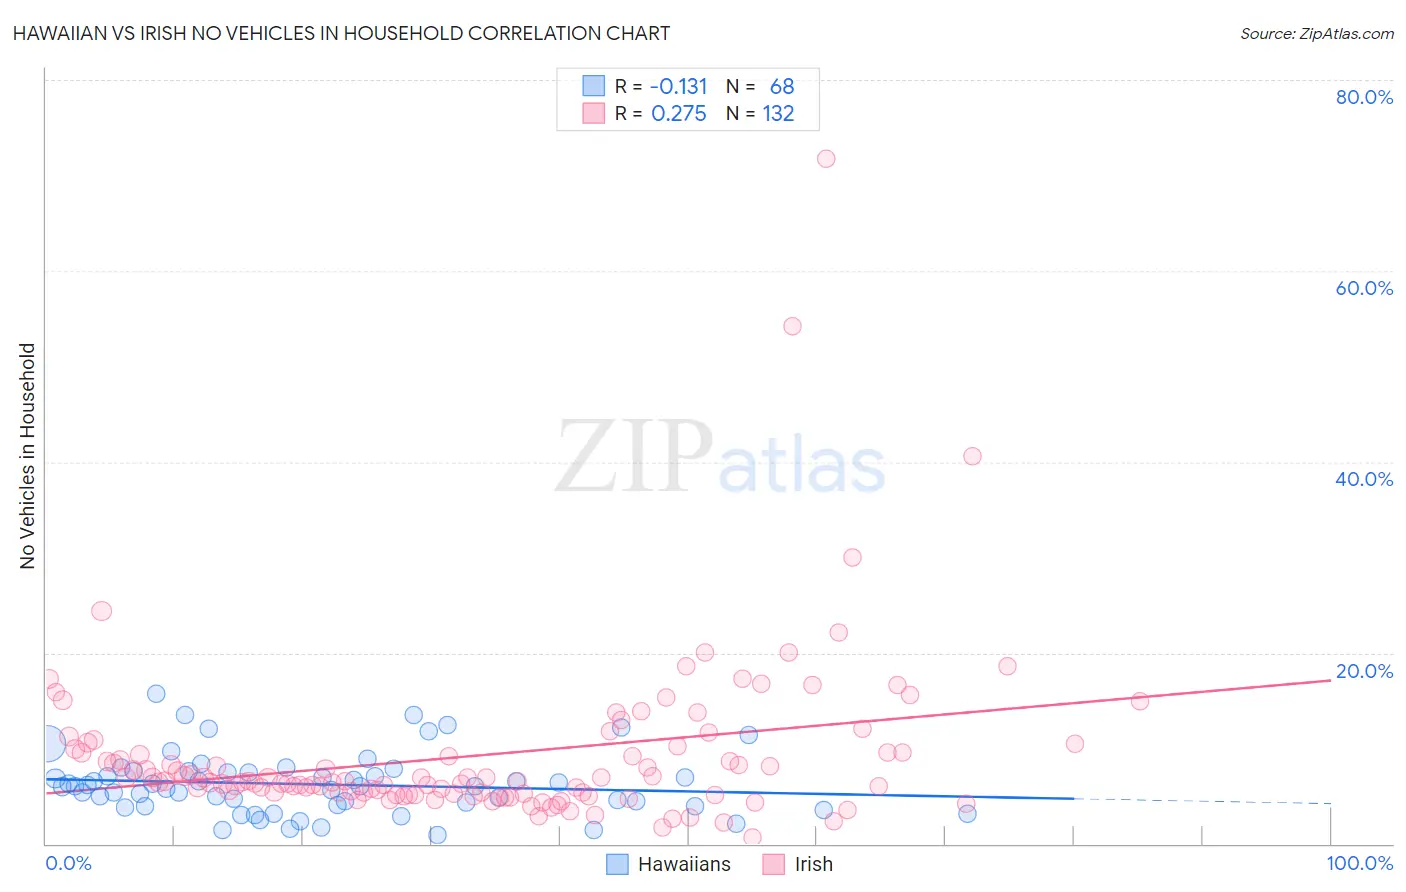
Hawaiian vs Irish No Vehicles in Household Correlation Chart
The statistical analysis conducted on geographies consisting of 326,809,450 people shows a poor negative correlation between the proportion of Hawaiians and percentage of households with no vehicle available in the United States with a correlation coefficient (R) of -0.131 and weighted average of 8.0%. Similarly, the statistical analysis conducted on geographies consisting of 573,311,233 people shows a weak positive correlation between the proportion of Irish and percentage of households with no vehicle available in the United States with a correlation coefficient (R) of 0.275 and weighted average of 7.4%, a difference of 8.1%.
No Vehicles in Household Correlation Summary
| Measurement | Hawaiian | Irish |
| Minimum | 0.92% | 0.63% |
| Maximum | 15.7% | 71.7% |
| Range | 14.7% | 71.1% |
| Mean | 6.2% | 9.3% |
| Median | 6.0% | 6.5% |
| Interquartile 25% (IQ1) | 4.0% | 5.3% |
| Interquartile 75% (IQ3) | 7.5% | 9.8% |
| Interquartile Range (IQR) | 3.5% | 4.5% |
| Standard Deviation (Sample) | 3.2% | 8.8% |
| Standard Deviation (Population) | 3.2% | 8.8% |
Similar Demographics by No Vehicles in Household
Demographics Similar to Hawaiians by No Vehicles in Household
In terms of no vehicles in household, the demographic groups most similar to Hawaiians are Slovene (8.0%, a difference of 0.0%), Immigrants from Venezuela (8.1%, a difference of 0.31%), Celtic (8.1%, a difference of 0.40%), Korean (8.0%, a difference of 0.58%), and Belgian (8.0%, a difference of 0.68%).
| Demographics | Rating | Rank | No Vehicles in Household |
| Immigrants | Nonimmigrants | 99.9 /100 | #45 | Exceptional 7.9% |
| Spanish | 99.9 /100 | #46 | Exceptional 7.9% |
| Northern Europeans | 99.9 /100 | #47 | Exceptional 7.9% |
| Afghans | 99.9 /100 | #48 | Exceptional 8.0% |
| Guamanians/Chamorros | 99.9 /100 | #49 | Exceptional 8.0% |
| Belgians | 99.9 /100 | #50 | Exceptional 8.0% |
| Koreans | 99.9 /100 | #51 | Exceptional 8.0% |
| Hawaiians | 99.9 /100 | #52 | Exceptional 8.0% |
| Slovenes | 99.9 /100 | #53 | Exceptional 8.0% |
| Immigrants | Venezuela | 99.9 /100 | #54 | Exceptional 8.1% |
| Celtics | 99.9 /100 | #55 | Exceptional 8.1% |
| Immigrants | Afghanistan | 99.9 /100 | #56 | Exceptional 8.1% |
| Venezuelans | 99.8 /100 | #57 | Exceptional 8.1% |
| Immigrants | Mexico | 99.8 /100 | #58 | Exceptional 8.1% |
| Immigrants | India | 99.8 /100 | #59 | Exceptional 8.2% |
Demographics Similar to Irish by No Vehicles in Household
In terms of no vehicles in household, the demographic groups most similar to Irish are French (7.4%, a difference of 0.050%), Immigrants from Iraq (7.5%, a difference of 0.44%), Nepalese (7.4%, a difference of 0.60%), Yaqui (7.5%, a difference of 0.61%), and Ottawa (7.4%, a difference of 0.75%).
| Demographics | Rating | Rank | No Vehicles in Household |
| Whites/Caucasians | 100.0 /100 | #15 | Exceptional 7.0% |
| Europeans | 100.0 /100 | #16 | Exceptional 7.1% |
| Welsh | 100.0 /100 | #17 | Exceptional 7.2% |
| Tongans | 100.0 /100 | #18 | Exceptional 7.2% |
| Arapaho | 100.0 /100 | #19 | Exceptional 7.4% |
| Ottawa | 100.0 /100 | #20 | Exceptional 7.4% |
| Nepalese | 100.0 /100 | #21 | Exceptional 7.4% |
| Irish | 100.0 /100 | #22 | Exceptional 7.4% |
| French | 100.0 /100 | #23 | Exceptional 7.4% |
| Immigrants | Iraq | 100.0 /100 | #24 | Exceptional 7.5% |
| Yaqui | 100.0 /100 | #25 | Exceptional 7.5% |
| Sri Lankans | 100.0 /100 | #26 | Exceptional 7.6% |
| British | 100.0 /100 | #27 | Exceptional 7.6% |
| Samoans | 100.0 /100 | #28 | Exceptional 7.6% |
| Americans | 100.0 /100 | #29 | Exceptional 7.7% |