Haitian vs Immigrants from Malaysia 2 or more Vehicles in Household
COMPARE
Haitian
Immigrants from Malaysia
2 or more Vehicles in Household
2 or more Vehicles in Household Comparison
Haitians
Immigrants from Malaysia
47.6%
2 OR MORE VEHICLES IN HOUSEHOLD
0.0/ 100
METRIC RATING
312th/ 347
METRIC RANK
52.7%
2 OR MORE VEHICLES IN HOUSEHOLD
0.8/ 100
METRIC RATING
254th/ 347
METRIC RANK
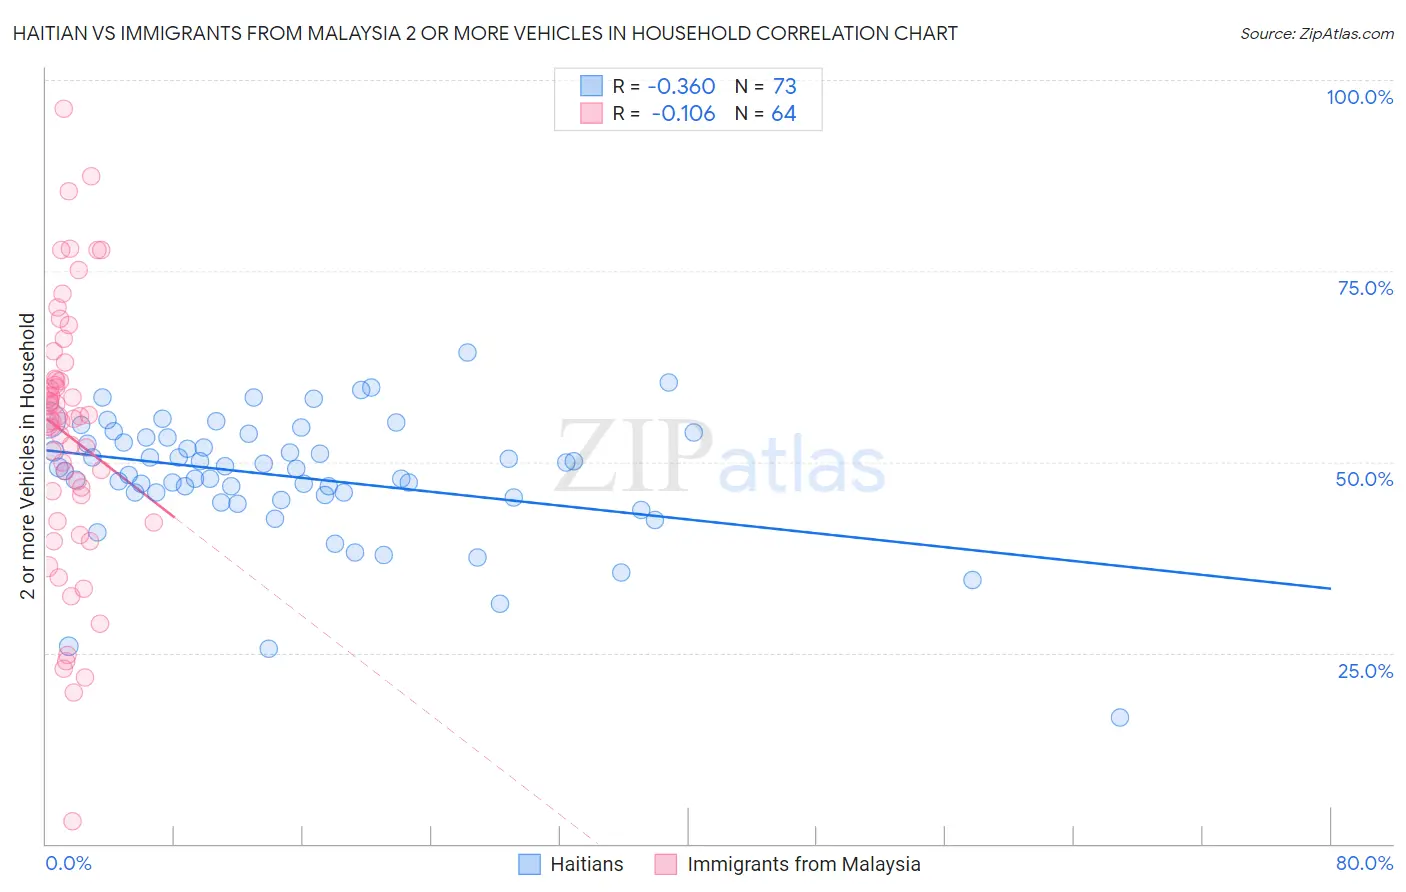
Haitian vs Immigrants from Malaysia 2 or more Vehicles in Household Correlation Chart
The statistical analysis conducted on geographies consisting of 287,580,413 people shows a mild negative correlation between the proportion of Haitians and percentage of households with 2 or more vehicles available in the United States with a correlation coefficient (R) of -0.360 and weighted average of 47.6%. Similarly, the statistical analysis conducted on geographies consisting of 197,930,354 people shows a poor negative correlation between the proportion of Immigrants from Malaysia and percentage of households with 2 or more vehicles available in the United States with a correlation coefficient (R) of -0.106 and weighted average of 52.7%, a difference of 10.7%.
2 or more Vehicles in Household Correlation Summary
| Measurement | Haitian | Immigrants from Malaysia |
| Minimum | 16.5% | 2.9% |
| Maximum | 64.4% | 96.2% |
| Range | 47.8% | 93.3% |
| Mean | 48.0% | 53.5% |
| Median | 49.1% | 55.5% |
| Interquartile 25% (IQ1) | 45.5% | 43.9% |
| Interquartile 75% (IQ3) | 53.2% | 60.8% |
| Interquartile Range (IQR) | 7.6% | 16.9% |
| Standard Deviation (Sample) | 8.2% | 17.5% |
| Standard Deviation (Population) | 8.2% | 17.3% |
Similar Demographics by 2 or more Vehicles in Household
Demographics Similar to Haitians by 2 or more Vehicles in Household
In terms of 2 or more vehicles in household, the demographic groups most similar to Haitians are U.S. Virgin Islander (47.5%, a difference of 0.17%), Immigrants from Ghana (47.4%, a difference of 0.40%), Immigrants from Belarus (47.9%, a difference of 0.74%), Ghanaian (48.0%, a difference of 0.86%), and Puerto Rican (47.1%, a difference of 0.97%).
| Demographics | Rating | Rank | 2 or more Vehicles in Household |
| Immigrants | Western Africa | 0.0 /100 | #305 | Tragic 49.4% |
| Immigrants | Israel | 0.0 /100 | #306 | Tragic 49.2% |
| Hopi | 0.0 /100 | #307 | Tragic 49.0% |
| Albanians | 0.0 /100 | #308 | Tragic 49.0% |
| Moroccans | 0.0 /100 | #309 | Tragic 48.8% |
| Ghanaians | 0.0 /100 | #310 | Tragic 48.0% |
| Immigrants | Belarus | 0.0 /100 | #311 | Tragic 47.9% |
| Haitians | 0.0 /100 | #312 | Tragic 47.6% |
| U.S. Virgin Islanders | 0.0 /100 | #313 | Tragic 47.5% |
| Immigrants | Ghana | 0.0 /100 | #314 | Tragic 47.4% |
| Puerto Ricans | 0.0 /100 | #315 | Tragic 47.1% |
| Cape Verdeans | 0.0 /100 | #316 | Tragic 46.8% |
| Immigrants | Haiti | 0.0 /100 | #317 | Tragic 46.5% |
| Immigrants | Albania | 0.0 /100 | #318 | Tragic 46.0% |
| Jamaicans | 0.0 /100 | #319 | Tragic 45.8% |
Demographics Similar to Immigrants from Malaysia by 2 or more Vehicles in Household
In terms of 2 or more vehicles in household, the demographic groups most similar to Immigrants from Malaysia are Uruguayan (52.7%, a difference of 0.030%), Immigrants from Eritrea (52.6%, a difference of 0.070%), Nigerian (52.8%, a difference of 0.19%), Immigrants from Hong Kong (52.6%, a difference of 0.21%), and Immigrants from Portugal (52.8%, a difference of 0.24%).
| Demographics | Rating | Rank | 2 or more Vehicles in Household |
| Sierra Leoneans | 1.2 /100 | #247 | Tragic 52.9% |
| Colombians | 1.1 /100 | #248 | Tragic 52.9% |
| Immigrants | Brazil | 1.0 /100 | #249 | Tragic 52.8% |
| Mongolians | 1.0 /100 | #250 | Tragic 52.8% |
| Immigrants | Sudan | 1.0 /100 | #251 | Tragic 52.8% |
| Immigrants | Portugal | 1.0 /100 | #252 | Tragic 52.8% |
| Nigerians | 0.9 /100 | #253 | Tragic 52.8% |
| Immigrants | Malaysia | 0.8 /100 | #254 | Tragic 52.7% |
| Uruguayans | 0.7 /100 | #255 | Tragic 52.7% |
| Immigrants | Eritrea | 0.7 /100 | #256 | Tragic 52.6% |
| Immigrants | Hong Kong | 0.6 /100 | #257 | Tragic 52.6% |
| Central American Indians | 0.6 /100 | #258 | Tragic 52.5% |
| Alsatians | 0.6 /100 | #259 | Tragic 52.5% |
| Immigrants | Bahamas | 0.5 /100 | #260 | Tragic 52.5% |
| Immigrants | Australia | 0.5 /100 | #261 | Tragic 52.4% |