Sudanese vs Celtic 1 or more Vehicles in Household
COMPARE
Sudanese
Celtic
1 or more Vehicles in Household
1 or more Vehicles in Household Comparison
Sudanese
Celtics
90.3%
1 OR MORE VEHICLES IN HOUSEHOLD
85.2/ 100
METRIC RATING
140th/ 347
METRIC RANK
92.1%
1 OR MORE VEHICLES IN HOUSEHOLD
99.9/ 100
METRIC RATING
51st/ 347
METRIC RANK
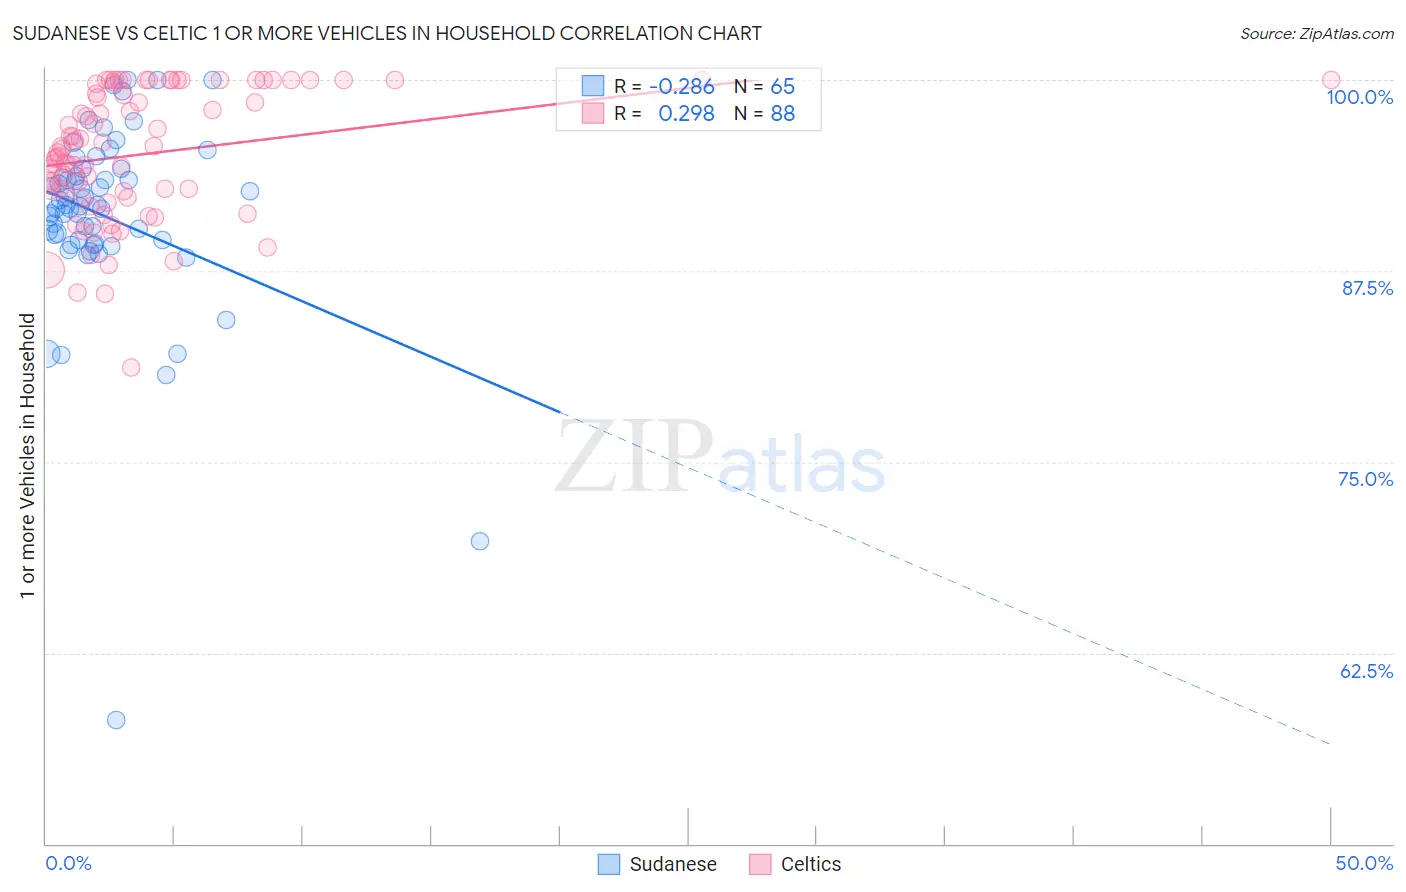
Sudanese vs Celtic 1 or more Vehicles in Household Correlation Chart
The statistical analysis conducted on geographies consisting of 110,123,391 people shows a weak negative correlation between the proportion of Sudanese and percentage of households with 1 or more vehicles available in the United States with a correlation coefficient (R) of -0.286 and weighted average of 90.3%. Similarly, the statistical analysis conducted on geographies consisting of 168,861,273 people shows a weak positive correlation between the proportion of Celtics and percentage of households with 1 or more vehicles available in the United States with a correlation coefficient (R) of 0.298 and weighted average of 92.1%, a difference of 2.0%.
1 or more Vehicles in Household Correlation Summary
| Measurement | Sudanese | Celtic |
| Minimum | 58.1% | 81.1% |
| Maximum | 100.0% | 100.0% |
| Range | 41.9% | 18.9% |
| Mean | 91.1% | 95.2% |
| Median | 91.7% | 95.4% |
| Interquartile 25% (IQ1) | 89.4% | 92.4% |
| Interquartile 75% (IQ3) | 93.9% | 99.8% |
| Interquartile Range (IQR) | 4.5% | 7.4% |
| Standard Deviation (Sample) | 6.5% | 4.2% |
| Standard Deviation (Population) | 6.4% | 4.2% |
Similar Demographics by 1 or more Vehicles in Household
Demographics Similar to Sudanese by 1 or more Vehicles in Household
In terms of 1 or more vehicles in household, the demographic groups most similar to Sudanese are Estonian (90.3%, a difference of 0.010%), Latvian (90.3%, a difference of 0.030%), Syrian (90.3%, a difference of 0.030%), Hungarian (90.3%, a difference of 0.040%), and Kenyan (90.4%, a difference of 0.060%).
| Demographics | Rating | Rank | 1 or more Vehicles in Household |
| Immigrants | Syria | 87.5 /100 | #133 | Excellent 90.4% |
| Kenyans | 87.0 /100 | #134 | Excellent 90.4% |
| Immigrants | Oceania | 86.9 /100 | #135 | Excellent 90.4% |
| Hungarians | 86.5 /100 | #136 | Excellent 90.3% |
| Latvians | 86.3 /100 | #137 | Excellent 90.3% |
| Syrians | 86.3 /100 | #138 | Excellent 90.3% |
| Estonians | 85.6 /100 | #139 | Excellent 90.3% |
| Sudanese | 85.2 /100 | #140 | Excellent 90.3% |
| Immigrants | Moldova | 83.1 /100 | #141 | Excellent 90.2% |
| Immigrants | Lithuania | 83.0 /100 | #142 | Excellent 90.2% |
| Immigrants | Bahamas | 81.5 /100 | #143 | Excellent 90.2% |
| Immigrants | Zimbabwe | 81.5 /100 | #144 | Excellent 90.2% |
| Sioux | 81.3 /100 | #145 | Excellent 90.2% |
| Bahamians | 80.5 /100 | #146 | Excellent 90.2% |
| Chileans | 79.8 /100 | #147 | Good 90.2% |
Demographics Similar to Celtics by 1 or more Vehicles in Household
In terms of 1 or more vehicles in household, the demographic groups most similar to Celtics are Guamanian/Chamorro (92.1%, a difference of 0.010%), Afghan (92.1%, a difference of 0.020%), Belgian (92.1%, a difference of 0.030%), Korean (92.1%, a difference of 0.030%), and Hawaiian (92.0%, a difference of 0.060%).
| Demographics | Rating | Rank | 1 or more Vehicles in Household |
| Choctaw | 99.9 /100 | #44 | Exceptional 92.2% |
| Immigrants | Nonimmigrants | 99.9 /100 | #45 | Exceptional 92.2% |
| Immigrants | Fiji | 99.9 /100 | #46 | Exceptional 92.2% |
| Northern Europeans | 99.9 /100 | #47 | Exceptional 92.2% |
| Belgians | 99.9 /100 | #48 | Exceptional 92.1% |
| Afghans | 99.9 /100 | #49 | Exceptional 92.1% |
| Guamanians/Chamorros | 99.9 /100 | #50 | Exceptional 92.1% |
| Celtics | 99.9 /100 | #51 | Exceptional 92.1% |
| Koreans | 99.9 /100 | #52 | Exceptional 92.1% |
| Hawaiians | 99.9 /100 | #53 | Exceptional 92.0% |
| Slovenes | 99.9 /100 | #54 | Exceptional 92.0% |
| Immigrants | Afghanistan | 99.9 /100 | #55 | Exceptional 92.0% |
| Immigrants | Venezuela | 99.9 /100 | #56 | Exceptional 92.0% |
| Iraqis | 99.8 /100 | #57 | Exceptional 91.9% |
| Immigrants | Mexico | 99.8 /100 | #58 | Exceptional 91.9% |