French American Indian vs Black/African American 1 or more Vehicles in Household
COMPARE
French American Indian
Black/African American
1 or more Vehicles in Household
1 or more Vehicles in Household Comparison
French American Indians
Blacks/African Americans
89.8%
1 OR MORE VEHICLES IN HOUSEHOLD
54.4/ 100
METRIC RATING
171st/ 347
METRIC RANK
88.2%
1 OR MORE VEHICLES IN HOUSEHOLD
1.4/ 100
METRIC RATING
249th/ 347
METRIC RANK
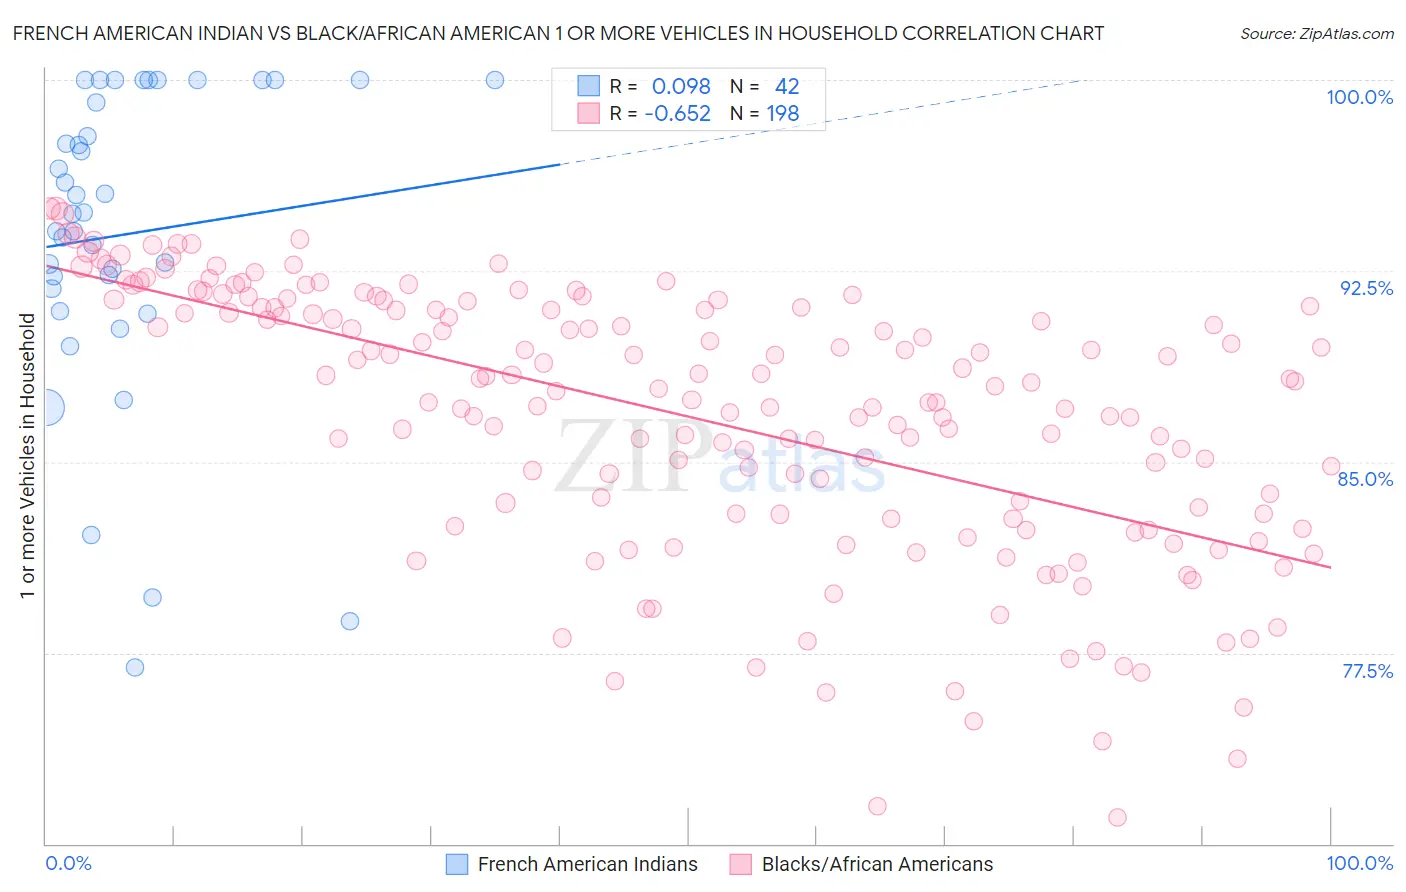
French American Indian vs Black/African American 1 or more Vehicles in Household Correlation Chart
The statistical analysis conducted on geographies consisting of 131,972,990 people shows a slight positive correlation between the proportion of French American Indians and percentage of households with 1 or more vehicles available in the United States with a correlation coefficient (R) of 0.098 and weighted average of 89.8%. Similarly, the statistical analysis conducted on geographies consisting of 553,575,215 people shows a significant negative correlation between the proportion of Blacks/African Americans and percentage of households with 1 or more vehicles available in the United States with a correlation coefficient (R) of -0.652 and weighted average of 88.2%, a difference of 1.8%.
1 or more Vehicles in Household Correlation Summary
| Measurement | French American Indian | Black/African American |
| Minimum | 76.9% | 71.0% |
| Maximum | 100.0% | 95.0% |
| Range | 23.1% | 23.9% |
| Mean | 93.9% | 86.8% |
| Median | 94.8% | 87.9% |
| Interquartile 25% (IQ1) | 91.8% | 82.9% |
| Interquartile 75% (IQ3) | 100.0% | 91.1% |
| Interquartile Range (IQR) | 8.2% | 8.1% |
| Standard Deviation (Sample) | 6.1% | 5.3% |
| Standard Deviation (Population) | 6.0% | 5.3% |
Similar Demographics by 1 or more Vehicles in Household
Demographics Similar to French American Indians by 1 or more Vehicles in Household
In terms of 1 or more vehicles in household, the demographic groups most similar to French American Indians are Indonesian (89.7%, a difference of 0.020%), Lumbee (89.7%, a difference of 0.020%), Immigrants from Costa Rica (89.8%, a difference of 0.050%), Filipino (89.7%, a difference of 0.070%), and Native/Alaskan (89.8%, a difference of 0.080%).
| Demographics | Rating | Rank | 1 or more Vehicles in Household |
| Comanche | 63.4 /100 | #164 | Good 89.9% |
| Immigrants | Saudi Arabia | 62.6 /100 | #165 | Good 89.9% |
| Immigrants | Middle Africa | 62.2 /100 | #166 | Good 89.9% |
| Immigrants | Latin America | 60.3 /100 | #167 | Good 89.8% |
| Immigrants | Cambodia | 60.1 /100 | #168 | Good 89.8% |
| Natives/Alaskans | 59.5 /100 | #169 | Average 89.8% |
| Immigrants | Costa Rica | 57.6 /100 | #170 | Average 89.8% |
| French American Indians | 54.4 /100 | #171 | Average 89.8% |
| Indonesians | 53.0 /100 | #172 | Average 89.7% |
| Lumbee | 52.8 /100 | #173 | Average 89.7% |
| Filipinos | 50.0 /100 | #174 | Average 89.7% |
| Immigrants | Burma/Myanmar | 47.6 /100 | #175 | Average 89.7% |
| Immigrants | Sudan | 47.1 /100 | #176 | Average 89.7% |
| Hmong | 45.8 /100 | #177 | Average 89.6% |
| Immigrants | El Salvador | 44.1 /100 | #178 | Average 89.6% |
Demographics Similar to Blacks/African Americans by 1 or more Vehicles in Household
In terms of 1 or more vehicles in household, the demographic groups most similar to Blacks/African Americans are Egyptian (88.2%, a difference of 0.040%), Immigrants from Nigeria (88.2%, a difference of 0.050%), Immigrants from Serbia (88.2%, a difference of 0.050%), Immigrants from Honduras (88.3%, a difference of 0.090%), and Immigrants from Uruguay (88.1%, a difference of 0.11%).
| Demographics | Rating | Rank | 1 or more Vehicles in Household |
| Turks | 2.5 /100 | #242 | Tragic 88.4% |
| Immigrants | Belgium | 2.1 /100 | #243 | Tragic 88.4% |
| Immigrants | Portugal | 2.0 /100 | #244 | Tragic 88.3% |
| Immigrants | Czechoslovakia | 1.9 /100 | #245 | Tragic 88.3% |
| Menominee | 1.9 /100 | #246 | Tragic 88.3% |
| Immigrants | Honduras | 1.7 /100 | #247 | Tragic 88.3% |
| Immigrants | Nigeria | 1.5 /100 | #248 | Tragic 88.2% |
| Blacks/African Americans | 1.4 /100 | #249 | Tragic 88.2% |
| Egyptians | 1.2 /100 | #250 | Tragic 88.2% |
| Immigrants | Serbia | 1.2 /100 | #251 | Tragic 88.2% |
| Immigrants | Uruguay | 1.1 /100 | #252 | Tragic 88.1% |
| Hondurans | 1.0 /100 | #253 | Tragic 88.1% |
| Haitians | 0.9 /100 | #254 | Tragic 88.1% |
| Immigrants | Latvia | 0.9 /100 | #255 | Tragic 88.1% |
| Colombians | 0.9 /100 | #256 | Tragic 88.0% |