French American Indian vs Black/African American 10th Grade
COMPARE
French American Indian
Black/African American
10th Grade
10th Grade Comparison
French American Indians
Blacks/African Americans
93.7%
10TH GRADE
50.9/ 100
METRIC RATING
172nd/ 347
METRIC RANK
93.2%
10TH GRADE
6.0/ 100
METRIC RATING
227th/ 347
METRIC RANK
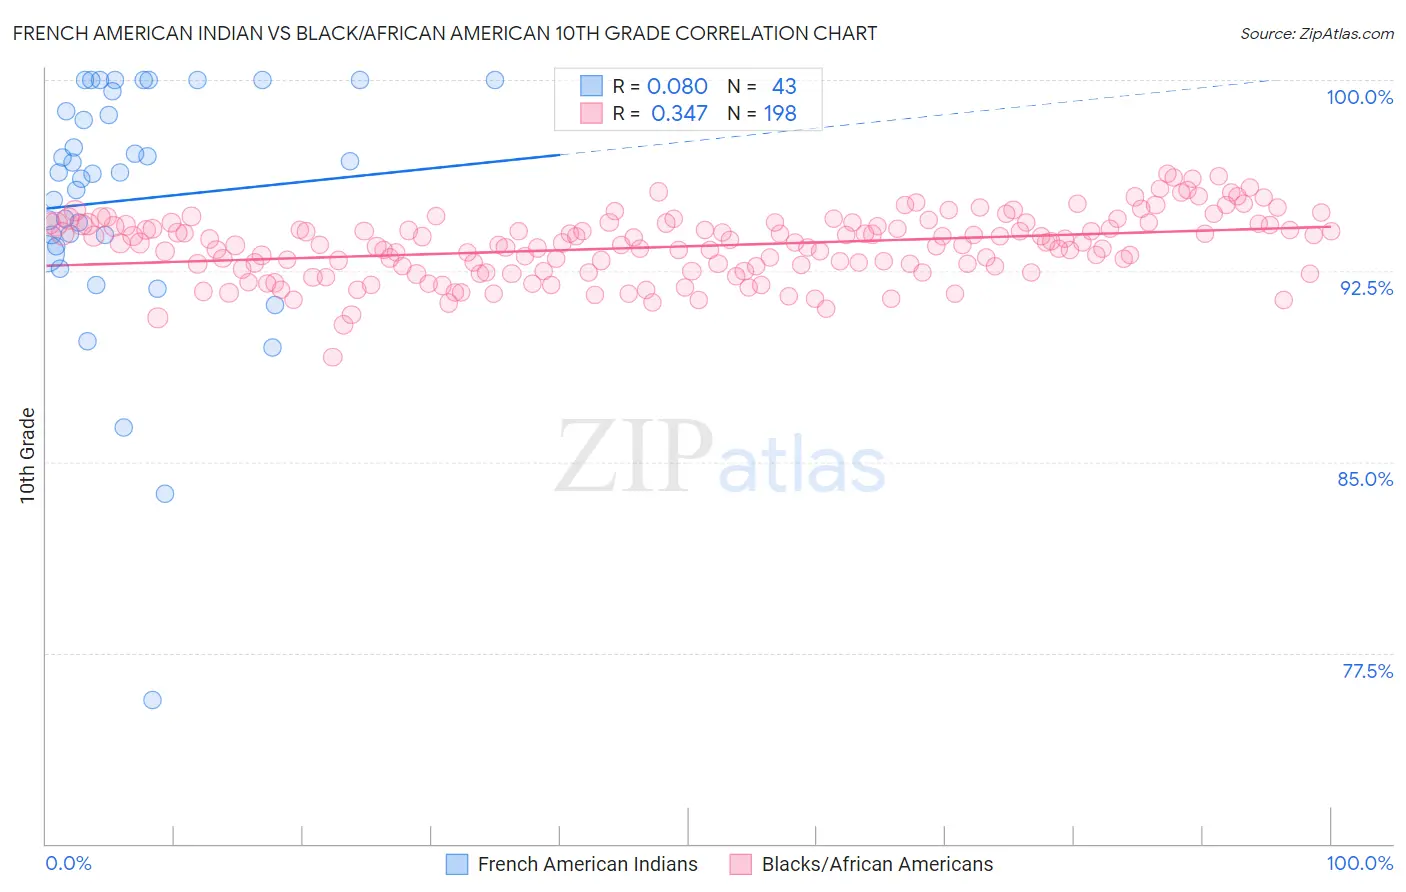
French American Indian vs Black/African American 10th Grade Correlation Chart
The statistical analysis conducted on geographies consisting of 131,976,269 people shows a slight positive correlation between the proportion of French American Indians and percentage of population with at least 10th grade education in the United States with a correlation coefficient (R) of 0.080 and weighted average of 93.7%. Similarly, the statistical analysis conducted on geographies consisting of 566,038,555 people shows a mild positive correlation between the proportion of Blacks/African Americans and percentage of population with at least 10th grade education in the United States with a correlation coefficient (R) of 0.347 and weighted average of 93.2%, a difference of 0.63%.
10th Grade Correlation Summary
| Measurement | French American Indian | Black/African American |
| Minimum | 75.6% | 89.1% |
| Maximum | 100.0% | 96.3% |
| Range | 24.4% | 7.2% |
| Mean | 95.3% | 93.5% |
| Median | 96.3% | 93.6% |
| Interquartile 25% (IQ1) | 93.5% | 92.6% |
| Interquartile 75% (IQ3) | 99.6% | 94.3% |
| Interquartile Range (IQR) | 6.1% | 1.8% |
| Standard Deviation (Sample) | 4.9% | 1.3% |
| Standard Deviation (Population) | 4.9% | 1.3% |
Similar Demographics by 10th Grade
Demographics Similar to French American Indians by 10th Grade
In terms of 10th grade, the demographic groups most similar to French American Indians are Immigrants from Albania (93.8%, a difference of 0.010%), Spaniard (93.7%, a difference of 0.010%), Argentinean (93.7%, a difference of 0.010%), Immigrants from Nepal (93.7%, a difference of 0.010%), and Immigrants from Venezuela (93.8%, a difference of 0.030%).
| Demographics | Rating | Rank | 10th Grade |
| Brazilians | 63.6 /100 | #165 | Good 93.8% |
| Immigrants | Iraq | 63.0 /100 | #166 | Good 93.8% |
| Immigrants | Egypt | 62.3 /100 | #167 | Good 93.8% |
| Alsatians | 59.4 /100 | #168 | Average 93.8% |
| Immigrants | Spain | 55.9 /100 | #169 | Average 93.8% |
| Immigrants | Venezuela | 53.9 /100 | #170 | Average 93.8% |
| Immigrants | Albania | 52.4 /100 | #171 | Average 93.8% |
| French American Indians | 50.9 /100 | #172 | Average 93.7% |
| Spaniards | 50.3 /100 | #173 | Average 93.7% |
| Argentineans | 50.0 /100 | #174 | Average 93.7% |
| Immigrants | Nepal | 49.6 /100 | #175 | Average 93.7% |
| Immigrants | Argentina | 47.1 /100 | #176 | Average 93.7% |
| Immigrants | Lebanon | 47.1 /100 | #177 | Average 93.7% |
| Sierra Leoneans | 46.1 /100 | #178 | Average 93.7% |
| Paraguayans | 45.3 /100 | #179 | Average 93.7% |
Demographics Similar to Blacks/African Americans by 10th Grade
In terms of 10th grade, the demographic groups most similar to Blacks/African Americans are Somali (93.2%, a difference of 0.0%), Korean (93.2%, a difference of 0.0%), Immigrants from China (93.2%, a difference of 0.010%), Bolivian (93.2%, a difference of 0.020%), and Immigrants from Ethiopia (93.1%, a difference of 0.040%).
| Demographics | Rating | Rank | 10th Grade |
| Tongans | 9.5 /100 | #220 | Tragic 93.3% |
| Immigrants | Southern Europe | 8.9 /100 | #221 | Tragic 93.2% |
| Ethiopians | 7.9 /100 | #222 | Tragic 93.2% |
| Immigrants | Sierra Leone | 7.6 /100 | #223 | Tragic 93.2% |
| Bolivians | 6.7 /100 | #224 | Tragic 93.2% |
| Somalis | 6.2 /100 | #225 | Tragic 93.2% |
| Koreans | 6.1 /100 | #226 | Tragic 93.2% |
| Blacks/African Americans | 6.0 /100 | #227 | Tragic 93.2% |
| Immigrants | China | 5.9 /100 | #228 | Tragic 93.2% |
| Immigrants | Ethiopia | 5.1 /100 | #229 | Tragic 93.1% |
| Immigrants | Africa | 5.0 /100 | #230 | Tragic 93.1% |
| South American Indians | 4.9 /100 | #231 | Tragic 93.1% |
| Bahamians | 4.9 /100 | #232 | Tragic 93.1% |
| Comanche | 4.9 /100 | #233 | Tragic 93.1% |
| Sub-Saharan Africans | 4.7 /100 | #234 | Tragic 93.1% |