Immigrants from Nepal vs Paraguayan 4 or more Vehicles in Household
COMPARE
Immigrants from Nepal
Paraguayan
4 or more Vehicles in Household
4 or more Vehicles in Household Comparison
Immigrants from Nepal
Paraguayans
5.6%
4 OR MORE VEHICLES IN HOUSEHOLD
0.9/ 100
METRIC RATING
266th/ 347
METRIC RANK
4.9%
4 OR MORE VEHICLES IN HOUSEHOLD
0.0/ 100
METRIC RATING
308th/ 347
METRIC RANK
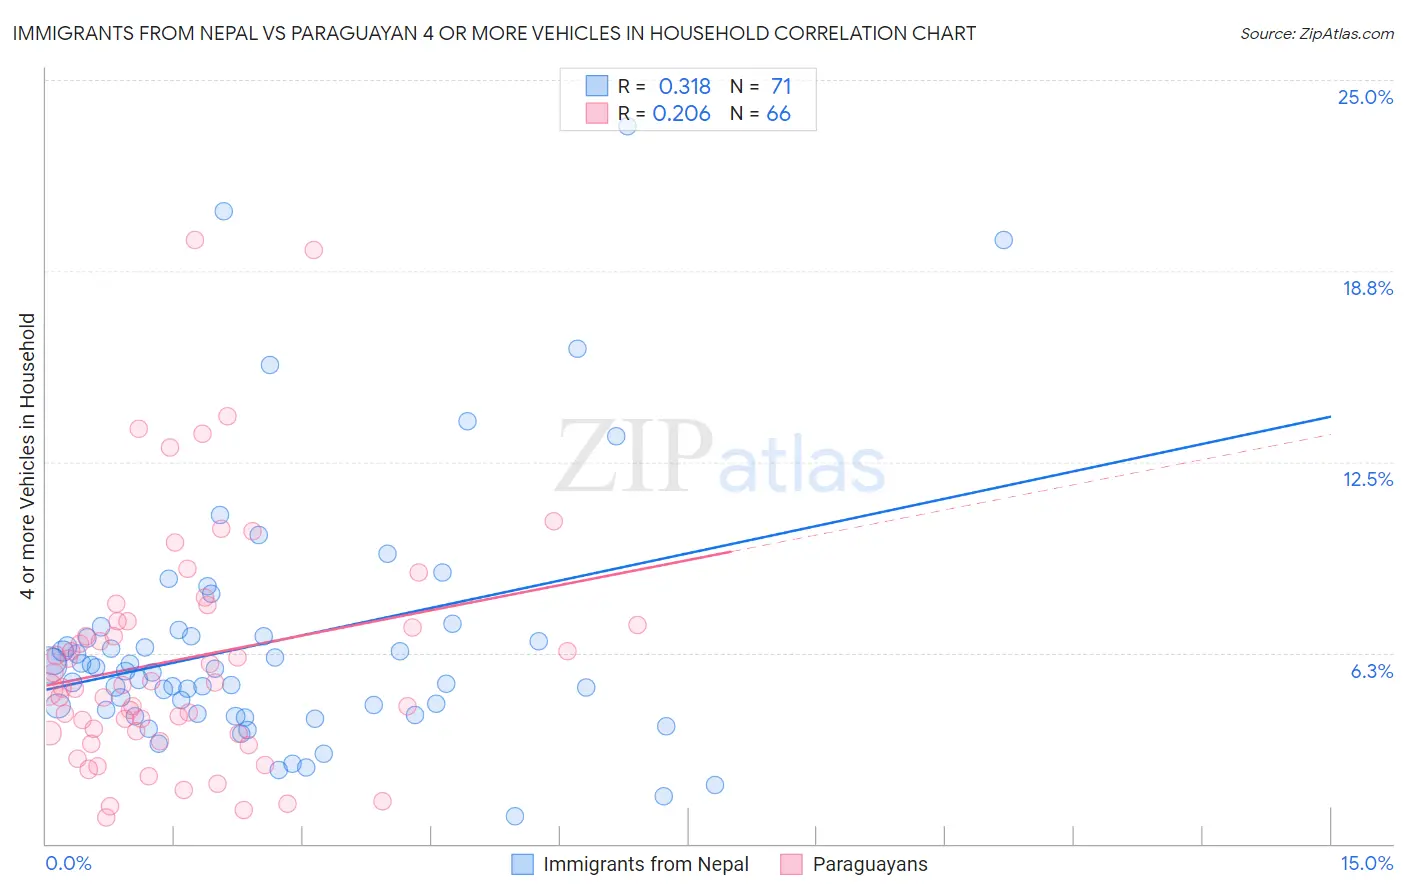
Immigrants from Nepal vs Paraguayan 4 or more Vehicles in Household Correlation Chart
The statistical analysis conducted on geographies consisting of 186,146,815 people shows a mild positive correlation between the proportion of Immigrants from Nepal and percentage of households with 4 or more vehicles available in the United States with a correlation coefficient (R) of 0.318 and weighted average of 5.6%. Similarly, the statistical analysis conducted on geographies consisting of 94,888,057 people shows a weak positive correlation between the proportion of Paraguayans and percentage of households with 4 or more vehicles available in the United States with a correlation coefficient (R) of 0.206 and weighted average of 4.9%, a difference of 12.8%.
4 or more Vehicles in Household Correlation Summary
| Measurement | Immigrants from Nepal | Paraguayan |
| Minimum | 0.91% | 0.86% |
| Maximum | 23.5% | 19.8% |
| Range | 22.6% | 18.9% |
| Mean | 6.6% | 6.1% |
| Median | 5.7% | 5.1% |
| Interquartile 25% (IQ1) | 4.2% | 3.6% |
| Interquartile 75% (IQ3) | 6.8% | 7.3% |
| Interquartile Range (IQR) | 2.6% | 3.7% |
| Standard Deviation (Sample) | 4.2% | 3.9% |
| Standard Deviation (Population) | 4.2% | 3.9% |
Similar Demographics by 4 or more Vehicles in Household
Demographics Similar to Immigrants from Nepal by 4 or more Vehicles in Household
In terms of 4 or more vehicles in household, the demographic groups most similar to Immigrants from Nepal are South American (5.6%, a difference of 0.020%), Immigrants from Ukraine (5.6%, a difference of 0.080%), Immigrants from Africa (5.6%, a difference of 0.24%), Colombian (5.5%, a difference of 0.51%), and Carpatho Rusyn (5.5%, a difference of 0.67%).
| Demographics | Rating | Rank | 4 or more Vehicles in Household |
| Immigrants | France | 1.3 /100 | #259 | Tragic 5.6% |
| Uruguayans | 1.3 /100 | #260 | Tragic 5.6% |
| Sudanese | 1.2 /100 | #261 | Tragic 5.6% |
| Bermudans | 1.2 /100 | #262 | Tragic 5.6% |
| Immigrants | Saudi Arabia | 1.1 /100 | #263 | Tragic 5.6% |
| Immigrants | Africa | 1.0 /100 | #264 | Tragic 5.6% |
| South Americans | 0.9 /100 | #265 | Tragic 5.6% |
| Immigrants | Nepal | 0.9 /100 | #266 | Tragic 5.6% |
| Immigrants | Ukraine | 0.9 /100 | #267 | Tragic 5.6% |
| Colombians | 0.7 /100 | #268 | Tragic 5.5% |
| Carpatho Rusyns | 0.7 /100 | #269 | Tragic 5.5% |
| Okinawans | 0.6 /100 | #270 | Tragic 5.5% |
| Immigrants | Sudan | 0.6 /100 | #271 | Tragic 5.5% |
| Immigrants | Kazakhstan | 0.6 /100 | #272 | Tragic 5.5% |
| Macedonians | 0.6 /100 | #273 | Tragic 5.5% |
Demographics Similar to Paraguayans by 4 or more Vehicles in Household
In terms of 4 or more vehicles in household, the demographic groups most similar to Paraguayans are Immigrants from Somalia (4.9%, a difference of 0.15%), Moroccan (4.9%, a difference of 0.54%), Houma (4.9%, a difference of 0.54%), Menominee (5.0%, a difference of 0.72%), and Immigrants from Serbia (5.0%, a difference of 1.7%).
| Demographics | Rating | Rank | 4 or more Vehicles in Household |
| Immigrants | Zaire | 0.0 /100 | #301 | Tragic 5.1% |
| Bahamians | 0.0 /100 | #302 | Tragic 5.1% |
| Immigrants | Greece | 0.0 /100 | #303 | Tragic 5.1% |
| Cypriots | 0.0 /100 | #304 | Tragic 5.0% |
| Somalis | 0.0 /100 | #305 | Tragic 5.0% |
| Immigrants | Serbia | 0.0 /100 | #306 | Tragic 5.0% |
| Menominee | 0.0 /100 | #307 | Tragic 5.0% |
| Paraguayans | 0.0 /100 | #308 | Tragic 4.9% |
| Immigrants | Somalia | 0.0 /100 | #309 | Tragic 4.9% |
| Moroccans | 0.0 /100 | #310 | Tragic 4.9% |
| Houma | 0.0 /100 | #311 | Tragic 4.9% |
| Albanians | 0.0 /100 | #312 | Tragic 4.8% |
| Immigrants | Israel | 0.0 /100 | #313 | Tragic 4.8% |
| Immigrants | West Indies | 0.0 /100 | #314 | Tragic 4.7% |
| Immigrants | Belarus | 0.0 /100 | #315 | Tragic 4.7% |