English vs Immigrants from Jamaica 1 or more Vehicles in Household
COMPARE
English
Immigrants from Jamaica
1 or more Vehicles in Household
1 or more Vehicles in Household Comparison
English
Immigrants from Jamaica
93.8%
1 OR MORE VEHICLES IN HOUSEHOLD
100.0/ 100
METRIC RATING
2nd/ 347
METRIC RANK
85.8%
1 OR MORE VEHICLES IN HOUSEHOLD
0.0/ 100
METRIC RATING
295th/ 347
METRIC RANK
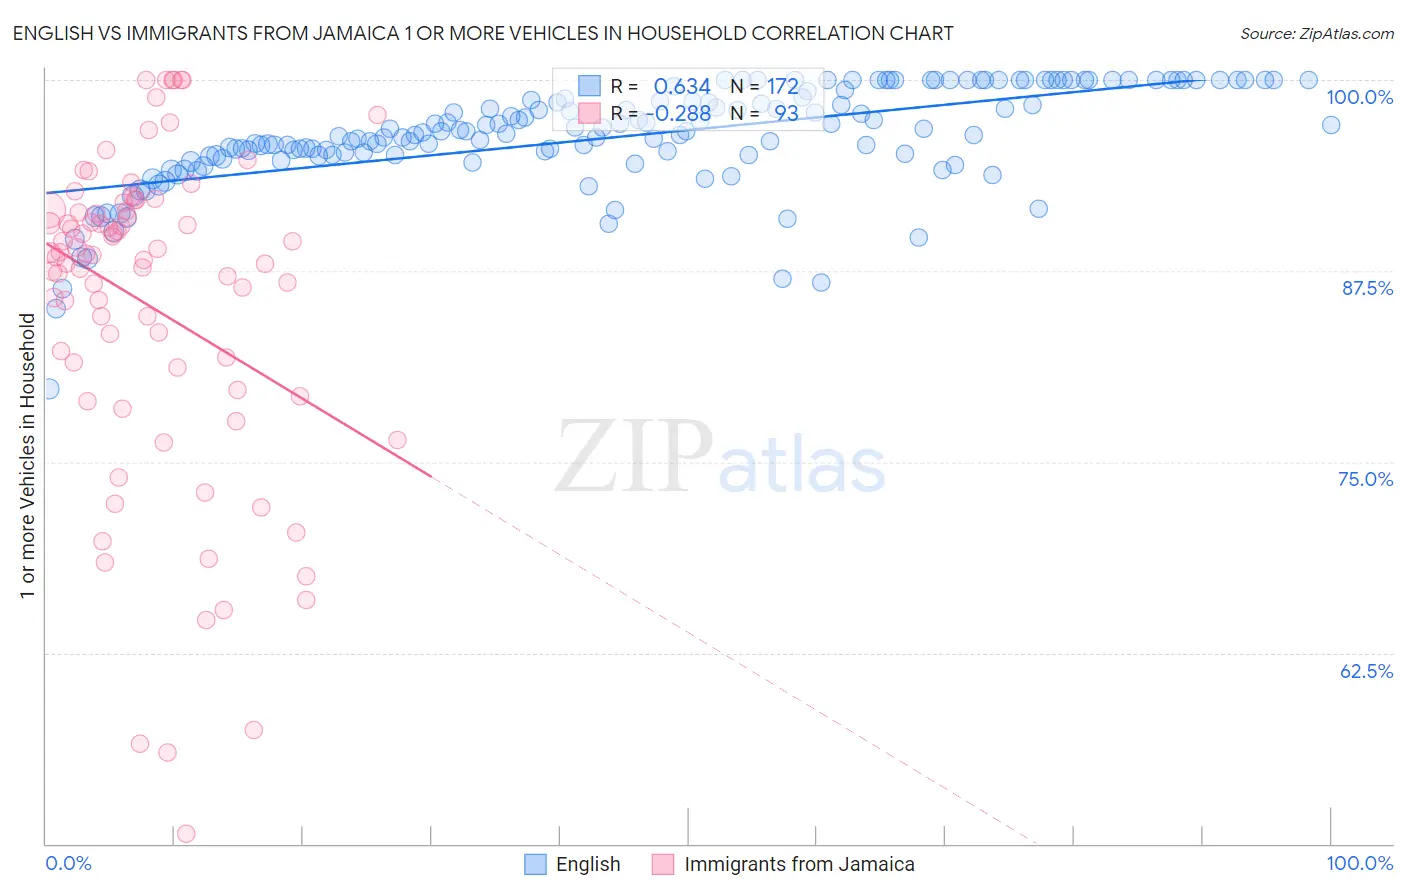
English vs Immigrants from Jamaica 1 or more Vehicles in Household Correlation Chart
The statistical analysis conducted on geographies consisting of 556,750,813 people shows a significant positive correlation between the proportion of English and percentage of households with 1 or more vehicles available in the United States with a correlation coefficient (R) of 0.634 and weighted average of 93.8%. Similarly, the statistical analysis conducted on geographies consisting of 291,409,527 people shows a weak negative correlation between the proportion of Immigrants from Jamaica and percentage of households with 1 or more vehicles available in the United States with a correlation coefficient (R) of -0.288 and weighted average of 85.8%, a difference of 9.3%.
1 or more Vehicles in Household Correlation Summary
| Measurement | English | Immigrants from Jamaica |
| Minimum | 79.8% | 50.6% |
| Maximum | 100.0% | 100.0% |
| Range | 20.2% | 49.4% |
| Mean | 96.3% | 85.3% |
| Median | 96.5% | 88.5% |
| Interquartile 25% (IQ1) | 95.1% | 80.4% |
| Interquartile 75% (IQ3) | 98.8% | 91.4% |
| Interquartile Range (IQR) | 3.8% | 11.0% |
| Standard Deviation (Sample) | 3.4% | 10.7% |
| Standard Deviation (Population) | 3.4% | 10.7% |
Similar Demographics by 1 or more Vehicles in Household
Demographics Similar to English by 1 or more Vehicles in Household
In terms of 1 or more vehicles in household, the demographic groups most similar to English are Norwegian (93.7%, a difference of 0.13%), German (93.6%, a difference of 0.17%), Yakama (93.6%, a difference of 0.27%), Danish (93.5%, a difference of 0.29%), and Scottish (93.4%, a difference of 0.48%).
| Demographics | Rating | Rank | 1 or more Vehicles in Household |
| Luxembourgers | 100.0 /100 | #1 | Exceptional 94.8% |
| English | 100.0 /100 | #2 | Exceptional 93.8% |
| Norwegians | 100.0 /100 | #3 | Exceptional 93.7% |
| Germans | 100.0 /100 | #4 | Exceptional 93.6% |
| Yakama | 100.0 /100 | #5 | Exceptional 93.6% |
| Danes | 100.0 /100 | #6 | Exceptional 93.5% |
| Scottish | 100.0 /100 | #7 | Exceptional 93.4% |
| Swedes | 100.0 /100 | #8 | Exceptional 93.3% |
| Scotch-Irish | 100.0 /100 | #9 | Exceptional 93.3% |
| Dutch | 100.0 /100 | #10 | Exceptional 93.3% |
| Czechs | 100.0 /100 | #11 | Exceptional 93.3% |
| Scandinavians | 100.0 /100 | #12 | Exceptional 93.1% |
| Whites/Caucasians | 100.0 /100 | #13 | Exceptional 93.1% |
| Irish | 100.0 /100 | #14 | Exceptional 93.1% |
| Mexicans | 100.0 /100 | #15 | Exceptional 93.0% |
Demographics Similar to Immigrants from Jamaica by 1 or more Vehicles in Household
In terms of 1 or more vehicles in household, the demographic groups most similar to Immigrants from Jamaica are Immigrants from Spain (85.8%, a difference of 0.030%), Paraguayan (85.7%, a difference of 0.12%), Alaskan Athabascan (86.0%, a difference of 0.17%), Belizean (85.7%, a difference of 0.20%), and Indian (Asian) (86.0%, a difference of 0.24%).
| Demographics | Rating | Rank | 1 or more Vehicles in Household |
| Hopi | 0.0 /100 | #288 | Tragic 86.4% |
| Immigrants | Ireland | 0.0 /100 | #289 | Tragic 86.4% |
| Immigrants | Australia | 0.0 /100 | #290 | Tragic 86.4% |
| Pima | 0.0 /100 | #291 | Tragic 86.3% |
| Okinawans | 0.0 /100 | #292 | Tragic 86.1% |
| Indians (Asian) | 0.0 /100 | #293 | Tragic 86.0% |
| Alaskan Athabascans | 0.0 /100 | #294 | Tragic 86.0% |
| Immigrants | Jamaica | 0.0 /100 | #295 | Tragic 85.8% |
| Immigrants | Spain | 0.0 /100 | #296 | Tragic 85.8% |
| Paraguayans | 0.0 /100 | #297 | Tragic 85.7% |
| Belizeans | 0.0 /100 | #298 | Tragic 85.7% |
| Yuman | 0.0 /100 | #299 | Tragic 85.5% |
| Immigrants | Russia | 0.0 /100 | #300 | Tragic 85.4% |
| Immigrants | Panama | 0.0 /100 | #301 | Tragic 85.4% |
| Moroccans | 0.0 /100 | #302 | Tragic 85.4% |