English vs Spaniard 1 or more Vehicles in Household
COMPARE
English
Spaniard
1 or more Vehicles in Household
1 or more Vehicles in Household Comparison
English
Spaniards
93.8%
1 OR MORE VEHICLES IN HOUSEHOLD
100.0/ 100
METRIC RATING
2nd/ 347
METRIC RANK
91.8%
1 OR MORE VEHICLES IN HOUSEHOLD
99.8/ 100
METRIC RATING
67th/ 347
METRIC RANK
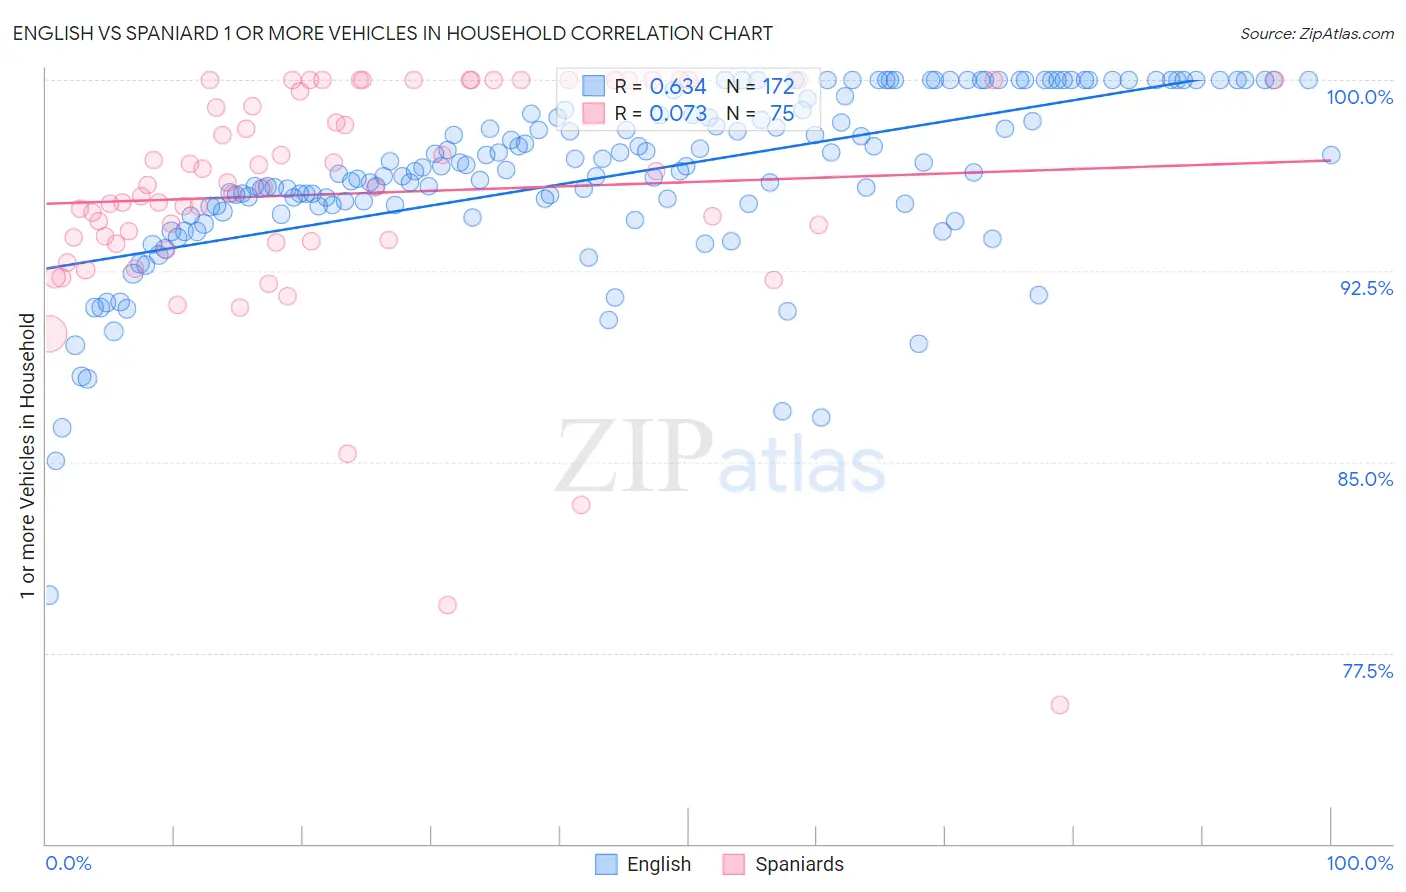
English vs Spaniard 1 or more Vehicles in Household Correlation Chart
The statistical analysis conducted on geographies consisting of 556,750,813 people shows a significant positive correlation between the proportion of English and percentage of households with 1 or more vehicles available in the United States with a correlation coefficient (R) of 0.634 and weighted average of 93.8%. Similarly, the statistical analysis conducted on geographies consisting of 443,238,522 people shows a slight positive correlation between the proportion of Spaniards and percentage of households with 1 or more vehicles available in the United States with a correlation coefficient (R) of 0.073 and weighted average of 91.8%, a difference of 2.2%.
1 or more Vehicles in Household Correlation Summary
| Measurement | English | Spaniard |
| Minimum | 79.8% | 75.5% |
| Maximum | 100.0% | 100.0% |
| Range | 20.2% | 24.5% |
| Mean | 96.3% | 95.5% |
| Median | 96.5% | 95.8% |
| Interquartile 25% (IQ1) | 95.1% | 93.7% |
| Interquartile 75% (IQ3) | 98.8% | 100.0% |
| Interquartile Range (IQR) | 3.8% | 6.3% |
| Standard Deviation (Sample) | 3.4% | 4.6% |
| Standard Deviation (Population) | 3.4% | 4.6% |
Similar Demographics by 1 or more Vehicles in Household
Demographics Similar to English by 1 or more Vehicles in Household
In terms of 1 or more vehicles in household, the demographic groups most similar to English are Norwegian (93.7%, a difference of 0.13%), German (93.6%, a difference of 0.17%), Yakama (93.6%, a difference of 0.27%), Danish (93.5%, a difference of 0.29%), and Scottish (93.4%, a difference of 0.48%).
| Demographics | Rating | Rank | 1 or more Vehicles in Household |
| Luxembourgers | 100.0 /100 | #1 | Exceptional 94.8% |
| English | 100.0 /100 | #2 | Exceptional 93.8% |
| Norwegians | 100.0 /100 | #3 | Exceptional 93.7% |
| Germans | 100.0 /100 | #4 | Exceptional 93.6% |
| Yakama | 100.0 /100 | #5 | Exceptional 93.6% |
| Danes | 100.0 /100 | #6 | Exceptional 93.5% |
| Scottish | 100.0 /100 | #7 | Exceptional 93.4% |
| Swedes | 100.0 /100 | #8 | Exceptional 93.3% |
| Scotch-Irish | 100.0 /100 | #9 | Exceptional 93.3% |
| Dutch | 100.0 /100 | #10 | Exceptional 93.3% |
| Czechs | 100.0 /100 | #11 | Exceptional 93.3% |
| Scandinavians | 100.0 /100 | #12 | Exceptional 93.1% |
| Whites/Caucasians | 100.0 /100 | #13 | Exceptional 93.1% |
| Irish | 100.0 /100 | #14 | Exceptional 93.1% |
| Mexicans | 100.0 /100 | #15 | Exceptional 93.0% |
Demographics Similar to Spaniards by 1 or more Vehicles in Household
In terms of 1 or more vehicles in household, the demographic groups most similar to Spaniards are Canadian (91.8%, a difference of 0.020%), Immigrants from Scotland (91.8%, a difference of 0.030%), Immigrants from Laos (91.8%, a difference of 0.040%), Croatian (91.9%, a difference of 0.070%), and Palestinian (91.7%, a difference of 0.070%).
| Demographics | Rating | Rank | 1 or more Vehicles in Household |
| Slovaks | 99.8 /100 | #60 | Exceptional 91.9% |
| Immigrants | India | 99.8 /100 | #61 | Exceptional 91.9% |
| Thais | 99.8 /100 | #62 | Exceptional 91.9% |
| Chinese | 99.8 /100 | #63 | Exceptional 91.9% |
| Croatians | 99.8 /100 | #64 | Exceptional 91.9% |
| Immigrants | Laos | 99.8 /100 | #65 | Exceptional 91.8% |
| Canadians | 99.8 /100 | #66 | Exceptional 91.8% |
| Spaniards | 99.8 /100 | #67 | Exceptional 91.8% |
| Immigrants | Scotland | 99.7 /100 | #68 | Exceptional 91.8% |
| Palestinians | 99.7 /100 | #69 | Exceptional 91.7% |
| Lithuanians | 99.7 /100 | #70 | Exceptional 91.7% |
| Poles | 99.7 /100 | #71 | Exceptional 91.7% |
| Cajuns | 99.7 /100 | #72 | Exceptional 91.7% |
| Immigrants | Iran | 99.7 /100 | #73 | Exceptional 91.7% |
| Immigrants | Lebanon | 99.6 /100 | #74 | Exceptional 91.6% |