Danish vs Immigrants from Sudan 3 or more Vehicles in Household
COMPARE
Danish
Immigrants from Sudan
3 or more Vehicles in Household
3 or more Vehicles in Household Comparison
Danes
Immigrants from Sudan
24.7%
3 OR MORE VEHICLES IN HOUSEHOLD
100.0/ 100
METRIC RATING
12th/ 347
METRIC RANK
17.6%
3 OR MORE VEHICLES IN HOUSEHOLD
0.5/ 100
METRIC RATING
273rd/ 347
METRIC RANK
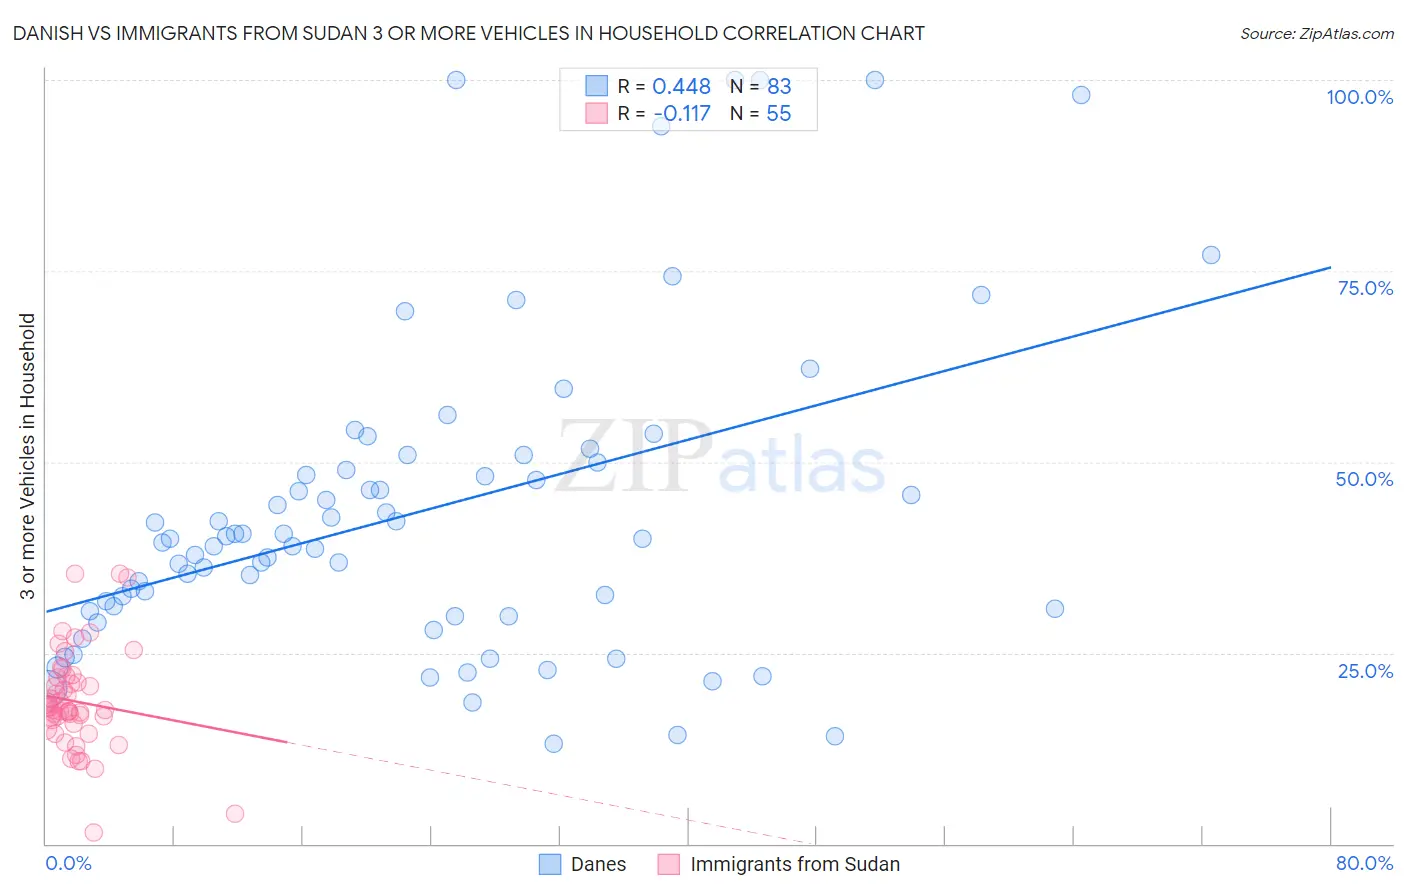
Danish vs Immigrants from Sudan 3 or more Vehicles in Household Correlation Chart
The statistical analysis conducted on geographies consisting of 473,746,883 people shows a moderate positive correlation between the proportion of Danes and percentage of households with 3 or more vehicles available in the United States with a correlation coefficient (R) of 0.448 and weighted average of 24.7%. Similarly, the statistical analysis conducted on geographies consisting of 118,948,382 people shows a poor negative correlation between the proportion of Immigrants from Sudan and percentage of households with 3 or more vehicles available in the United States with a correlation coefficient (R) of -0.117 and weighted average of 17.6%, a difference of 40.9%.
3 or more Vehicles in Household Correlation Summary
| Measurement | Danish | Immigrants from Sudan |
| Minimum | 13.0% | 1.5% |
| Maximum | 100.0% | 35.4% |
| Range | 87.0% | 33.8% |
| Mean | 43.5% | 18.6% |
| Median | 40.0% | 17.6% |
| Interquartile 25% (IQ1) | 30.5% | 15.6% |
| Interquartile 75% (IQ3) | 50.0% | 21.8% |
| Interquartile Range (IQR) | 19.5% | 6.2% |
| Standard Deviation (Sample) | 20.6% | 6.5% |
| Standard Deviation (Population) | 20.5% | 6.5% |
Similar Demographics by 3 or more Vehicles in Household
Demographics Similar to Danes by 3 or more Vehicles in Household
In terms of 3 or more vehicles in household, the demographic groups most similar to Danes are Mexican (24.7%, a difference of 0.080%), Immigrants from Mexico (24.6%, a difference of 0.52%), Shoshone (24.9%, a difference of 0.69%), Nepalese (24.9%, a difference of 0.79%), and Native Hawaiian (24.9%, a difference of 0.88%).
| Demographics | Rating | Rank | 3 or more Vehicles in Household |
| Puget Sound Salish | 100.0 /100 | #5 | Exceptional 26.4% |
| Immigrants | Fiji | 100.0 /100 | #6 | Exceptional 26.1% |
| Colville | 100.0 /100 | #7 | Exceptional 25.8% |
| Samoans | 100.0 /100 | #8 | Exceptional 25.0% |
| Native Hawaiians | 100.0 /100 | #9 | Exceptional 24.9% |
| Nepalese | 100.0 /100 | #10 | Exceptional 24.9% |
| Shoshone | 100.0 /100 | #11 | Exceptional 24.9% |
| Danes | 100.0 /100 | #12 | Exceptional 24.7% |
| Mexicans | 100.0 /100 | #13 | Exceptional 24.7% |
| Immigrants | Mexico | 100.0 /100 | #14 | Exceptional 24.6% |
| Hawaiians | 100.0 /100 | #15 | Exceptional 24.3% |
| Basques | 100.0 /100 | #16 | Exceptional 24.3% |
| Koreans | 100.0 /100 | #17 | Exceptional 24.1% |
| Norwegians | 100.0 /100 | #18 | Exceptional 23.9% |
| Chinese | 100.0 /100 | #19 | Exceptional 23.9% |
Demographics Similar to Immigrants from Sudan by 3 or more Vehicles in Household
In terms of 3 or more vehicles in household, the demographic groups most similar to Immigrants from Sudan are Immigrants from Africa (17.6%, a difference of 0.040%), Immigrants from Bosnia and Herzegovina (17.5%, a difference of 0.15%), Immigrants from Ukraine (17.5%, a difference of 0.44%), Immigrants from Nepal (17.6%, a difference of 0.45%), and South American (17.6%, a difference of 0.45%).
| Demographics | Rating | Rank | 3 or more Vehicles in Household |
| Macedonians | 0.8 /100 | #266 | Tragic 17.7% |
| Immigrants | Venezuela | 0.8 /100 | #267 | Tragic 17.7% |
| Immigrants | Bulgaria | 0.8 /100 | #268 | Tragic 17.7% |
| Immigrants | France | 0.6 /100 | #269 | Tragic 17.6% |
| Immigrants | Nepal | 0.6 /100 | #270 | Tragic 17.6% |
| South Americans | 0.6 /100 | #271 | Tragic 17.6% |
| Immigrants | Africa | 0.5 /100 | #272 | Tragic 17.6% |
| Immigrants | Sudan | 0.5 /100 | #273 | Tragic 17.6% |
| Immigrants | Bosnia and Herzegovina | 0.5 /100 | #274 | Tragic 17.5% |
| Immigrants | Ukraine | 0.4 /100 | #275 | Tragic 17.5% |
| Okinawans | 0.4 /100 | #276 | Tragic 17.4% |
| Brazilians | 0.4 /100 | #277 | Tragic 17.4% |
| Immigrants | Bahamas | 0.3 /100 | #278 | Tragic 17.4% |
| Immigrants | Kazakhstan | 0.3 /100 | #279 | Tragic 17.4% |
| Immigrants | Eastern Europe | 0.3 /100 | #280 | Tragic 17.4% |