Czechoslovakian vs Czech 1 or more Vehicles in Household
COMPARE
Czechoslovakian
Czech
1 or more Vehicles in Household
1 or more Vehicles in Household Comparison
Czechoslovakians
Czechs
92.3%
1 OR MORE VEHICLES IN HOUSEHOLD
99.9/ 100
METRIC RATING
35th/ 347
METRIC RANK
93.3%
1 OR MORE VEHICLES IN HOUSEHOLD
100.0/ 100
METRIC RATING
11th/ 347
METRIC RANK
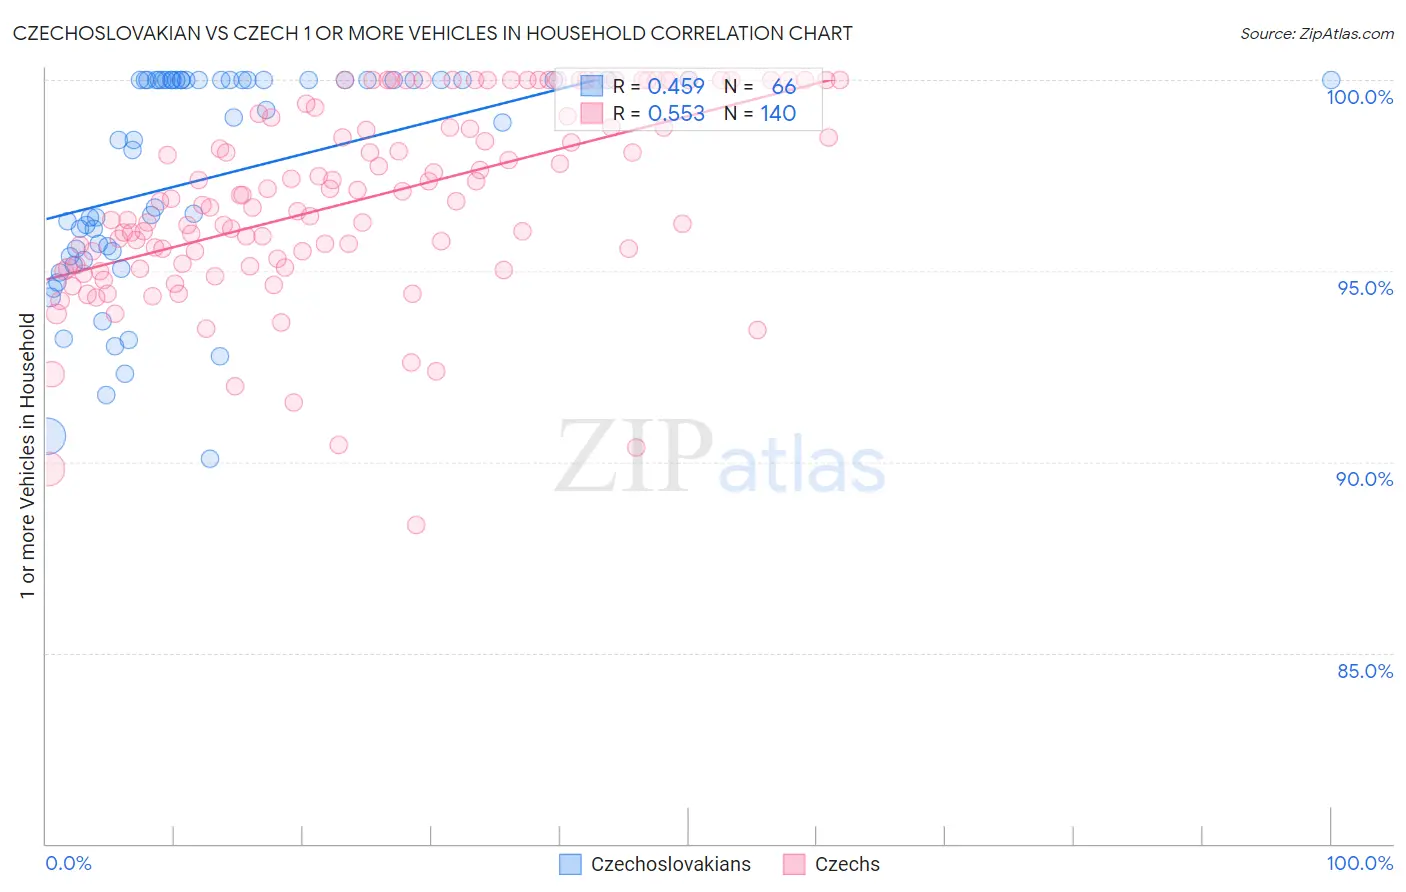
Czechoslovakian vs Czech 1 or more Vehicles in Household Correlation Chart
The statistical analysis conducted on geographies consisting of 368,548,563 people shows a moderate positive correlation between the proportion of Czechoslovakians and percentage of households with 1 or more vehicles available in the United States with a correlation coefficient (R) of 0.459 and weighted average of 92.3%. Similarly, the statistical analysis conducted on geographies consisting of 484,526,910 people shows a substantial positive correlation between the proportion of Czechs and percentage of households with 1 or more vehicles available in the United States with a correlation coefficient (R) of 0.553 and weighted average of 93.3%, a difference of 1.0%.
1 or more Vehicles in Household Correlation Summary
| Measurement | Czechoslovakian | Czech |
| Minimum | 90.1% | 88.4% |
| Maximum | 100.0% | 100.0% |
| Range | 9.9% | 11.6% |
| Mean | 97.5% | 96.8% |
| Median | 98.7% | 96.8% |
| Interquartile 25% (IQ1) | 95.4% | 95.2% |
| Interquartile 75% (IQ3) | 100.0% | 99.0% |
| Interquartile Range (IQR) | 4.6% | 3.9% |
| Standard Deviation (Sample) | 2.9% | 2.5% |
| Standard Deviation (Population) | 2.8% | 2.5% |
Similar Demographics by 1 or more Vehicles in Household
Demographics Similar to Czechoslovakians by 1 or more Vehicles in Household
In terms of 1 or more vehicles in household, the demographic groups most similar to Czechoslovakians are Malaysian (92.3%, a difference of 0.0%), Italian (92.3%, a difference of 0.010%), French Canadian (92.3%, a difference of 0.010%), Immigrants from Vietnam (92.3%, a difference of 0.020%), and Swiss (92.3%, a difference of 0.020%).
| Demographics | Rating | Rank | 1 or more Vehicles in Household |
| Sri Lankans | 100.0 /100 | #28 | Exceptional 92.5% |
| Native Hawaiians | 100.0 /100 | #29 | Exceptional 92.4% |
| Finns | 100.0 /100 | #30 | Exceptional 92.4% |
| Samoans | 100.0 /100 | #31 | Exceptional 92.4% |
| Basques | 100.0 /100 | #32 | Exceptional 92.4% |
| Cherokee | 100.0 /100 | #33 | Exceptional 92.4% |
| Italians | 99.9 /100 | #34 | Exceptional 92.3% |
| Czechoslovakians | 99.9 /100 | #35 | Exceptional 92.3% |
| Malaysians | 99.9 /100 | #36 | Exceptional 92.3% |
| French Canadians | 99.9 /100 | #37 | Exceptional 92.3% |
| Immigrants | Vietnam | 99.9 /100 | #38 | Exceptional 92.3% |
| Swiss | 99.9 /100 | #39 | Exceptional 92.3% |
| Creek | 99.9 /100 | #40 | Exceptional 92.3% |
| Immigrants | Taiwan | 99.9 /100 | #41 | Exceptional 92.3% |
| Chickasaw | 99.9 /100 | #42 | Exceptional 92.3% |
Demographics Similar to Czechs by 1 or more Vehicles in Household
In terms of 1 or more vehicles in household, the demographic groups most similar to Czechs are Dutch (93.3%, a difference of 0.030%), Scotch-Irish (93.3%, a difference of 0.060%), Swedish (93.3%, a difference of 0.070%), Scottish (93.4%, a difference of 0.12%), and Scandinavian (93.1%, a difference of 0.15%).
| Demographics | Rating | Rank | 1 or more Vehicles in Household |
| Germans | 100.0 /100 | #4 | Exceptional 93.6% |
| Yakama | 100.0 /100 | #5 | Exceptional 93.6% |
| Danes | 100.0 /100 | #6 | Exceptional 93.5% |
| Scottish | 100.0 /100 | #7 | Exceptional 93.4% |
| Swedes | 100.0 /100 | #8 | Exceptional 93.3% |
| Scotch-Irish | 100.0 /100 | #9 | Exceptional 93.3% |
| Dutch | 100.0 /100 | #10 | Exceptional 93.3% |
| Czechs | 100.0 /100 | #11 | Exceptional 93.3% |
| Scandinavians | 100.0 /100 | #12 | Exceptional 93.1% |
| Whites/Caucasians | 100.0 /100 | #13 | Exceptional 93.1% |
| Irish | 100.0 /100 | #14 | Exceptional 93.1% |
| Mexicans | 100.0 /100 | #15 | Exceptional 93.0% |
| Assyrians/Chaldeans/Syriacs | 100.0 /100 | #16 | Exceptional 93.0% |
| Europeans | 100.0 /100 | #17 | Exceptional 93.0% |
| Welsh | 100.0 /100 | #18 | Exceptional 93.0% |