Central American Indian vs Pakistani 4 or more Vehicles in Household
COMPARE
Central American Indian
Pakistani
4 or more Vehicles in Household
4 or more Vehicles in Household Comparison
Central American Indians
Pakistanis
6.5%
4 OR MORE VEHICLES IN HOUSEHOLD
71.1/ 100
METRIC RATING
154th/ 347
METRIC RANK
7.0%
4 OR MORE VEHICLES IN HOUSEHOLD
98.7/ 100
METRIC RATING
101st/ 347
METRIC RANK
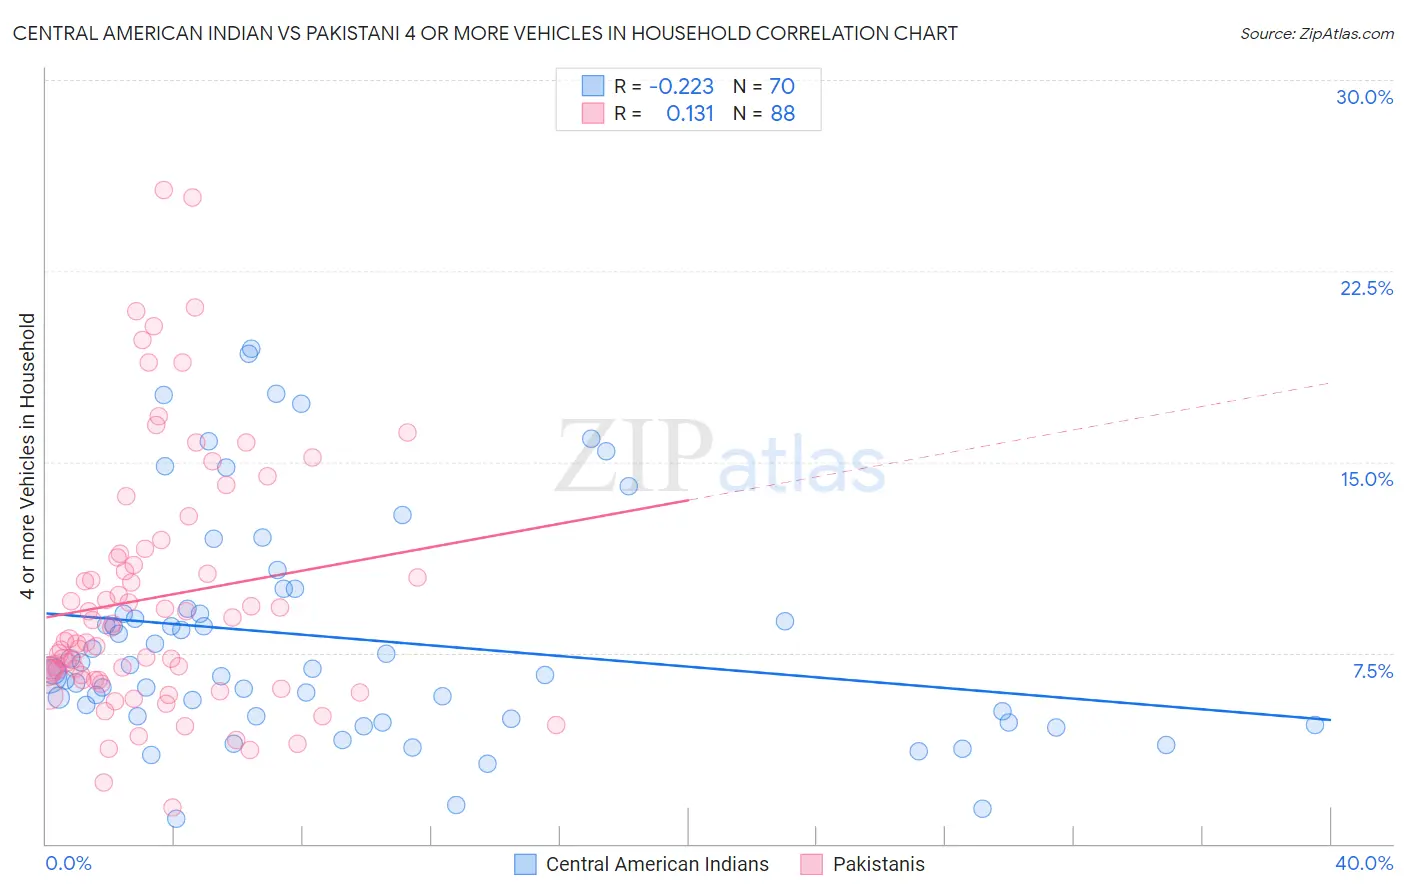
Central American Indian vs Pakistani 4 or more Vehicles in Household Correlation Chart
The statistical analysis conducted on geographies consisting of 324,790,558 people shows a weak negative correlation between the proportion of Central American Indians and percentage of households with 4 or more vehicles available in the United States with a correlation coefficient (R) of -0.223 and weighted average of 6.5%. Similarly, the statistical analysis conducted on geographies consisting of 334,097,212 people shows a poor positive correlation between the proportion of Pakistanis and percentage of households with 4 or more vehicles available in the United States with a correlation coefficient (R) of 0.131 and weighted average of 7.0%, a difference of 8.5%.
4 or more Vehicles in Household Correlation Summary
| Measurement | Central American Indian | Pakistani |
| Minimum | 1.00% | 1.4% |
| Maximum | 19.4% | 25.7% |
| Range | 18.4% | 24.2% |
| Mean | 8.1% | 9.7% |
| Median | 6.8% | 8.0% |
| Interquartile 25% (IQ1) | 5.0% | 6.4% |
| Interquartile 75% (IQ3) | 9.2% | 11.3% |
| Interquartile Range (IQR) | 4.2% | 4.9% |
| Standard Deviation (Sample) | 4.4% | 5.0% |
| Standard Deviation (Population) | 4.4% | 5.0% |
Similar Demographics by 4 or more Vehicles in Household
Demographics Similar to Central American Indians by 4 or more Vehicles in Household
In terms of 4 or more vehicles in household, the demographic groups most similar to Central American Indians are Immigrants from Armenia (6.5%, a difference of 0.010%), Iroquois (6.5%, a difference of 0.080%), Yuman (6.5%, a difference of 0.13%), Immigrants from Hong Kong (6.5%, a difference of 0.14%), and Iranian (6.5%, a difference of 0.14%).
| Demographics | Rating | Rank | 4 or more Vehicles in Household |
| Immigrants | Iran | 73.9 /100 | #147 | Good 6.5% |
| Immigrants | Jordan | 73.7 /100 | #148 | Good 6.5% |
| Greeks | 73.6 /100 | #149 | Good 6.5% |
| New Zealanders | 73.3 /100 | #150 | Good 6.5% |
| Immigrants | Hong Kong | 72.2 /100 | #151 | Good 6.5% |
| Yuman | 72.1 /100 | #152 | Good 6.5% |
| Immigrants | Armenia | 71.2 /100 | #153 | Good 6.5% |
| Central American Indians | 71.1 /100 | #154 | Good 6.5% |
| Iroquois | 70.4 /100 | #155 | Good 6.5% |
| Iranians | 69.9 /100 | #156 | Good 6.5% |
| Peruvians | 69.4 /100 | #157 | Good 6.5% |
| Zimbabweans | 67.1 /100 | #158 | Good 6.4% |
| Indians (Asian) | 66.3 /100 | #159 | Good 6.4% |
| Palestinians | 65.8 /100 | #160 | Good 6.4% |
| Immigrants | Cameroon | 64.4 /100 | #161 | Good 6.4% |
Demographics Similar to Pakistanis by 4 or more Vehicles in Household
In terms of 4 or more vehicles in household, the demographic groups most similar to Pakistanis are Taiwanese (7.0%, a difference of 0.070%), Asian (7.0%, a difference of 0.070%), Blackfeet (7.0%, a difference of 0.080%), Seminole (7.0%, a difference of 0.15%), and Hmong (7.0%, a difference of 0.56%).
| Demographics | Rating | Rank | 4 or more Vehicles in Household |
| Dutch West Indians | 99.3 /100 | #94 | Exceptional 7.1% |
| Czechoslovakians | 99.3 /100 | #95 | Exceptional 7.1% |
| Central Americans | 99.3 /100 | #96 | Exceptional 7.1% |
| Celtics | 99.1 /100 | #97 | Exceptional 7.1% |
| Irish | 99.0 /100 | #98 | Exceptional 7.1% |
| Seminole | 98.8 /100 | #99 | Exceptional 7.0% |
| Taiwanese | 98.7 /100 | #100 | Exceptional 7.0% |
| Pakistanis | 98.7 /100 | #101 | Exceptional 7.0% |
| Asians | 98.6 /100 | #102 | Exceptional 7.0% |
| Blackfeet | 98.6 /100 | #103 | Exceptional 7.0% |
| Hmong | 98.3 /100 | #104 | Exceptional 7.0% |
| German Russians | 98.3 /100 | #105 | Exceptional 7.0% |
| Guatemalans | 98.1 /100 | #106 | Exceptional 7.0% |
| Nicaraguans | 98.0 /100 | #107 | Exceptional 7.0% |
| French | 97.7 /100 | #108 | Exceptional 6.9% |