Central American Indian vs Immigrants from Greece Associate's Degree
COMPARE
Central American Indian
Immigrants from Greece
Associate's Degree
Associate's Degree Comparison
Central American Indians
Immigrants from Greece
40.8%
ASSOCIATE'S DEGREE
0.2/ 100
METRIC RATING
268th/ 347
METRIC RANK
52.1%
ASSOCIATE'S DEGREE
99.9/ 100
METRIC RATING
51st/ 347
METRIC RANK
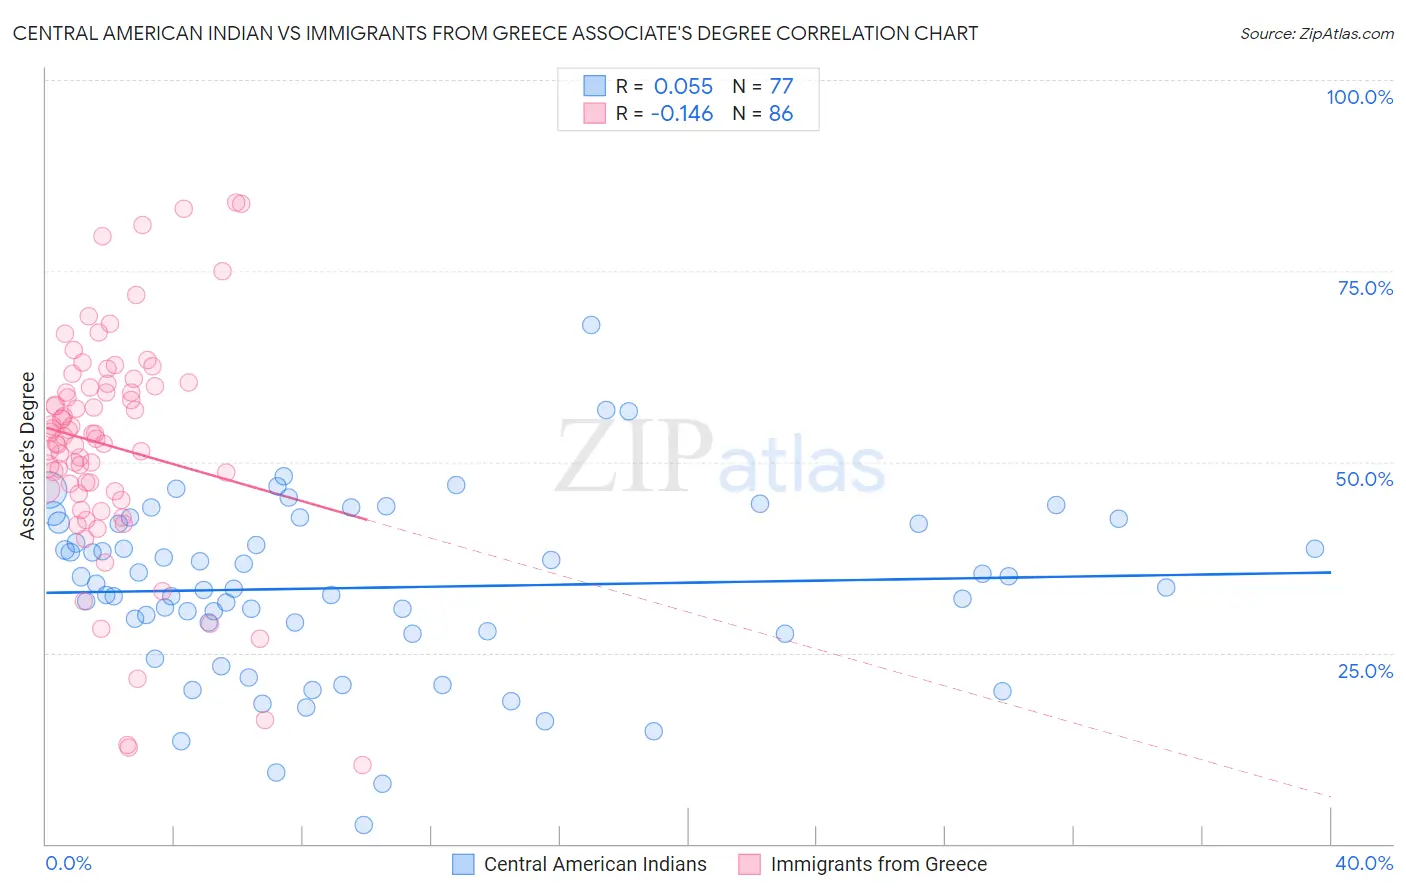
Central American Indian vs Immigrants from Greece Associate's Degree Correlation Chart
The statistical analysis conducted on geographies consisting of 326,135,740 people shows a slight positive correlation between the proportion of Central American Indians and percentage of population with at least associate's degree education in the United States with a correlation coefficient (R) of 0.055 and weighted average of 40.8%. Similarly, the statistical analysis conducted on geographies consisting of 216,878,450 people shows a poor negative correlation between the proportion of Immigrants from Greece and percentage of population with at least associate's degree education in the United States with a correlation coefficient (R) of -0.146 and weighted average of 52.1%, a difference of 27.6%.
Associate's Degree Correlation Summary
| Measurement | Central American Indian | Immigrants from Greece |
| Minimum | 2.5% | 10.3% |
| Maximum | 67.9% | 83.9% |
| Range | 65.4% | 73.6% |
| Mean | 33.5% | 52.1% |
| Median | 33.6% | 53.5% |
| Interquartile 25% (IQ1) | 27.7% | 46.1% |
| Interquartile 75% (IQ3) | 42.0% | 59.9% |
| Interquartile Range (IQR) | 14.3% | 13.8% |
| Standard Deviation (Sample) | 11.5% | 14.9% |
| Standard Deviation (Population) | 11.4% | 14.8% |
Similar Demographics by Associate's Degree
Demographics Similar to Central American Indians by Associate's Degree
In terms of associate's degree, the demographic groups most similar to Central American Indians are American (40.8%, a difference of 0.18%), Hawaiian (40.9%, a difference of 0.20%), Chippewa (40.7%, a difference of 0.23%), Immigrants from Laos (40.7%, a difference of 0.41%), and Belizean (40.6%, a difference of 0.48%).
| Demographics | Rating | Rank | Associate's Degree |
| Nicaraguans | 0.4 /100 | #261 | Tragic 41.5% |
| Bahamians | 0.4 /100 | #262 | Tragic 41.5% |
| Immigrants | Jamaica | 0.3 /100 | #263 | Tragic 41.5% |
| Osage | 0.3 /100 | #264 | Tragic 41.5% |
| Africans | 0.2 /100 | #265 | Tragic 41.1% |
| Samoans | 0.2 /100 | #266 | Tragic 41.1% |
| Hawaiians | 0.2 /100 | #267 | Tragic 40.9% |
| Central American Indians | 0.2 /100 | #268 | Tragic 40.8% |
| Americans | 0.2 /100 | #269 | Tragic 40.8% |
| Chippewa | 0.2 /100 | #270 | Tragic 40.7% |
| Immigrants | Laos | 0.1 /100 | #271 | Tragic 40.7% |
| Belizeans | 0.1 /100 | #272 | Tragic 40.6% |
| Puget Sound Salish | 0.1 /100 | #273 | Tragic 40.5% |
| Immigrants | Dominica | 0.1 /100 | #274 | Tragic 40.5% |
| Potawatomi | 0.1 /100 | #275 | Tragic 40.4% |
Demographics Similar to Immigrants from Greece by Associate's Degree
In terms of associate's degree, the demographic groups most similar to Immigrants from Greece are Asian (52.1%, a difference of 0.080%), Immigrants from Austria (52.1%, a difference of 0.10%), Bolivian (52.0%, a difference of 0.21%), Immigrants from Asia (52.0%, a difference of 0.23%), and Immigrants from Norway (52.2%, a difference of 0.29%).
| Demographics | Rating | Rank | Associate's Degree |
| Estonians | 99.9 /100 | #44 | Exceptional 52.5% |
| Immigrants | Lithuania | 99.9 /100 | #45 | Exceptional 52.4% |
| Immigrants | Bulgaria | 99.9 /100 | #46 | Exceptional 52.4% |
| Immigrants | Kuwait | 99.9 /100 | #47 | Exceptional 52.4% |
| Immigrants | Norway | 99.9 /100 | #48 | Exceptional 52.2% |
| Immigrants | Austria | 99.9 /100 | #49 | Exceptional 52.1% |
| Asians | 99.9 /100 | #50 | Exceptional 52.1% |
| Immigrants | Greece | 99.9 /100 | #51 | Exceptional 52.1% |
| Bolivians | 99.8 /100 | #52 | Exceptional 52.0% |
| Immigrants | Asia | 99.8 /100 | #53 | Exceptional 52.0% |
| Immigrants | Spain | 99.8 /100 | #54 | Exceptional 51.9% |
| Australians | 99.8 /100 | #55 | Exceptional 51.9% |
| Immigrants | Czechoslovakia | 99.8 /100 | #56 | Exceptional 51.9% |
| Paraguayans | 99.8 /100 | #57 | Exceptional 51.8% |
| New Zealanders | 99.8 /100 | #58 | Exceptional 51.8% |