Eastern European vs Pakistani 1 or more Vehicles in Household
COMPARE
Eastern European
Pakistani
1 or more Vehicles in Household
1 or more Vehicles in Household Comparison
Eastern Europeans
Pakistanis
88.5%
1 OR MORE VEHICLES IN HOUSEHOLD
3.0/ 100
METRIC RATING
240th/ 347
METRIC RANK
91.3%
1 OR MORE VEHICLES IN HOUSEHOLD
99.0/ 100
METRIC RATING
97th/ 347
METRIC RANK
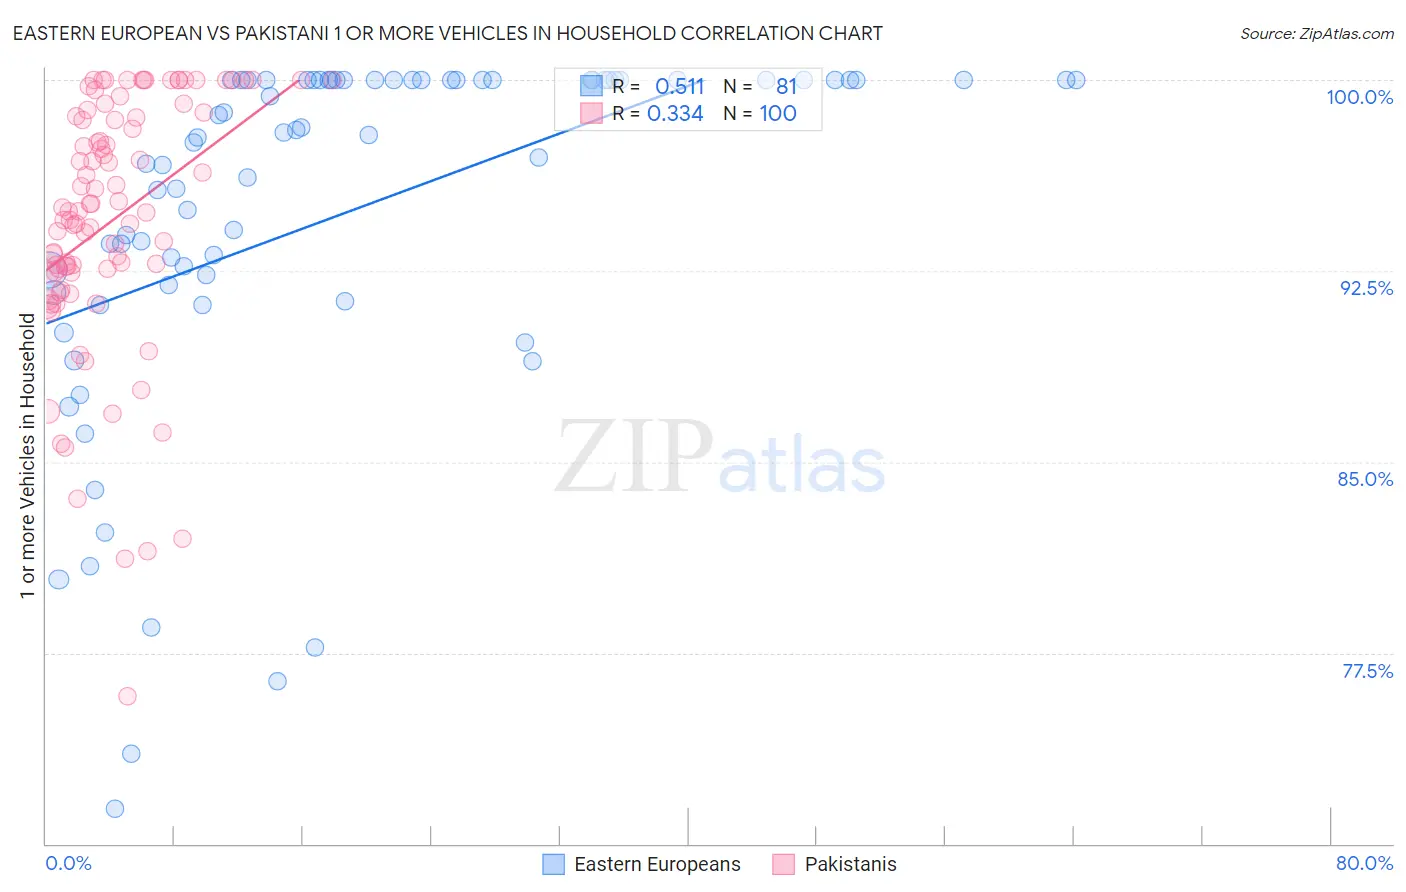
Eastern European vs Pakistani 1 or more Vehicles in Household Correlation Chart
The statistical analysis conducted on geographies consisting of 460,790,270 people shows a substantial positive correlation between the proportion of Eastern Europeans and percentage of households with 1 or more vehicles available in the United States with a correlation coefficient (R) of 0.511 and weighted average of 88.5%. Similarly, the statistical analysis conducted on geographies consisting of 335,009,492 people shows a mild positive correlation between the proportion of Pakistanis and percentage of households with 1 or more vehicles available in the United States with a correlation coefficient (R) of 0.334 and weighted average of 91.3%, a difference of 3.2%.
1 or more Vehicles in Household Correlation Summary
| Measurement | Eastern European | Pakistani |
| Minimum | 71.4% | 75.8% |
| Maximum | 100.0% | 100.0% |
| Range | 28.6% | 24.2% |
| Mean | 94.7% | 94.5% |
| Median | 97.8% | 94.8% |
| Interquartile 25% (IQ1) | 91.8% | 92.4% |
| Interquartile 75% (IQ3) | 100.0% | 98.6% |
| Interquartile Range (IQR) | 8.2% | 6.2% |
| Standard Deviation (Sample) | 7.1% | 5.0% |
| Standard Deviation (Population) | 7.0% | 4.9% |
Similar Demographics by 1 or more Vehicles in Household
Demographics Similar to Eastern Europeans by 1 or more Vehicles in Household
In terms of 1 or more vehicles in household, the demographic groups most similar to Eastern Europeans are Taiwanese (88.4%, a difference of 0.050%), Turkish (88.4%, a difference of 0.070%), Kiowa (88.6%, a difference of 0.10%), Immigrants from Belgium (88.4%, a difference of 0.13%), and Immigrants from Somalia (88.6%, a difference of 0.14%).
| Demographics | Rating | Rank | 1 or more Vehicles in Household |
| Houma | 4.8 /100 | #233 | Tragic 88.6% |
| Immigrants | Peru | 4.7 /100 | #234 | Tragic 88.6% |
| Paiute | 4.6 /100 | #235 | Tragic 88.6% |
| Immigrants | Pakistan | 4.5 /100 | #236 | Tragic 88.6% |
| Immigrants | Turkey | 4.4 /100 | #237 | Tragic 88.6% |
| Immigrants | Somalia | 4.2 /100 | #238 | Tragic 88.6% |
| Kiowa | 3.8 /100 | #239 | Tragic 88.6% |
| Eastern Europeans | 3.0 /100 | #240 | Tragic 88.5% |
| Taiwanese | 2.6 /100 | #241 | Tragic 88.4% |
| Turks | 2.5 /100 | #242 | Tragic 88.4% |
| Immigrants | Belgium | 2.1 /100 | #243 | Tragic 88.4% |
| Immigrants | Portugal | 2.0 /100 | #244 | Tragic 88.3% |
| Immigrants | Czechoslovakia | 1.9 /100 | #245 | Tragic 88.3% |
| Menominee | 1.9 /100 | #246 | Tragic 88.3% |
| Immigrants | Honduras | 1.7 /100 | #247 | Tragic 88.3% |
Demographics Similar to Pakistanis by 1 or more Vehicles in Household
In terms of 1 or more vehicles in household, the demographic groups most similar to Pakistanis are Potawatomi (91.3%, a difference of 0.010%), Austrian (91.3%, a difference of 0.020%), Immigrants from Cuba (91.3%, a difference of 0.030%), Immigrants from North America (91.4%, a difference of 0.090%), and Immigrants from Canada (91.4%, a difference of 0.10%).
| Demographics | Rating | Rank | 1 or more Vehicles in Household |
| Immigrants | Canada | 99.2 /100 | #90 | Exceptional 91.4% |
| Immigrants | Jordan | 99.2 /100 | #91 | Exceptional 91.4% |
| Bhutanese | 99.2 /100 | #92 | Exceptional 91.4% |
| Immigrants | North America | 99.2 /100 | #93 | Exceptional 91.4% |
| Immigrants | Cuba | 99.1 /100 | #94 | Exceptional 91.3% |
| Austrians | 99.0 /100 | #95 | Exceptional 91.3% |
| Potawatomi | 99.0 /100 | #96 | Exceptional 91.3% |
| Pakistanis | 99.0 /100 | #97 | Exceptional 91.3% |
| Slavs | 98.7 /100 | #98 | Exceptional 91.2% |
| Immigrants | Bolivia | 98.6 /100 | #99 | Exceptional 91.2% |
| Immigrants | Central America | 98.4 /100 | #100 | Exceptional 91.1% |
| Bulgarians | 98.4 /100 | #101 | Exceptional 91.1% |
| Seminole | 98.3 /100 | #102 | Exceptional 91.1% |
| Yugoslavians | 98.3 /100 | #103 | Exceptional 91.1% |
| Asians | 98.2 /100 | #104 | Exceptional 91.1% |