British West Indian vs Immigrants from Thailand No Vehicles in Household
COMPARE
British West Indian
Immigrants from Thailand
No Vehicles in Household
No Vehicles in Household Comparison
British West Indians
Immigrants from Thailand
29.7%
NO VEHICLES IN HOUSEHOLD
0.0/ 100
METRIC RATING
342nd/ 347
METRIC RANK
9.5%
NO VEHICLES IN HOUSEHOLD
92.6/ 100
METRIC RATING
120th/ 347
METRIC RANK
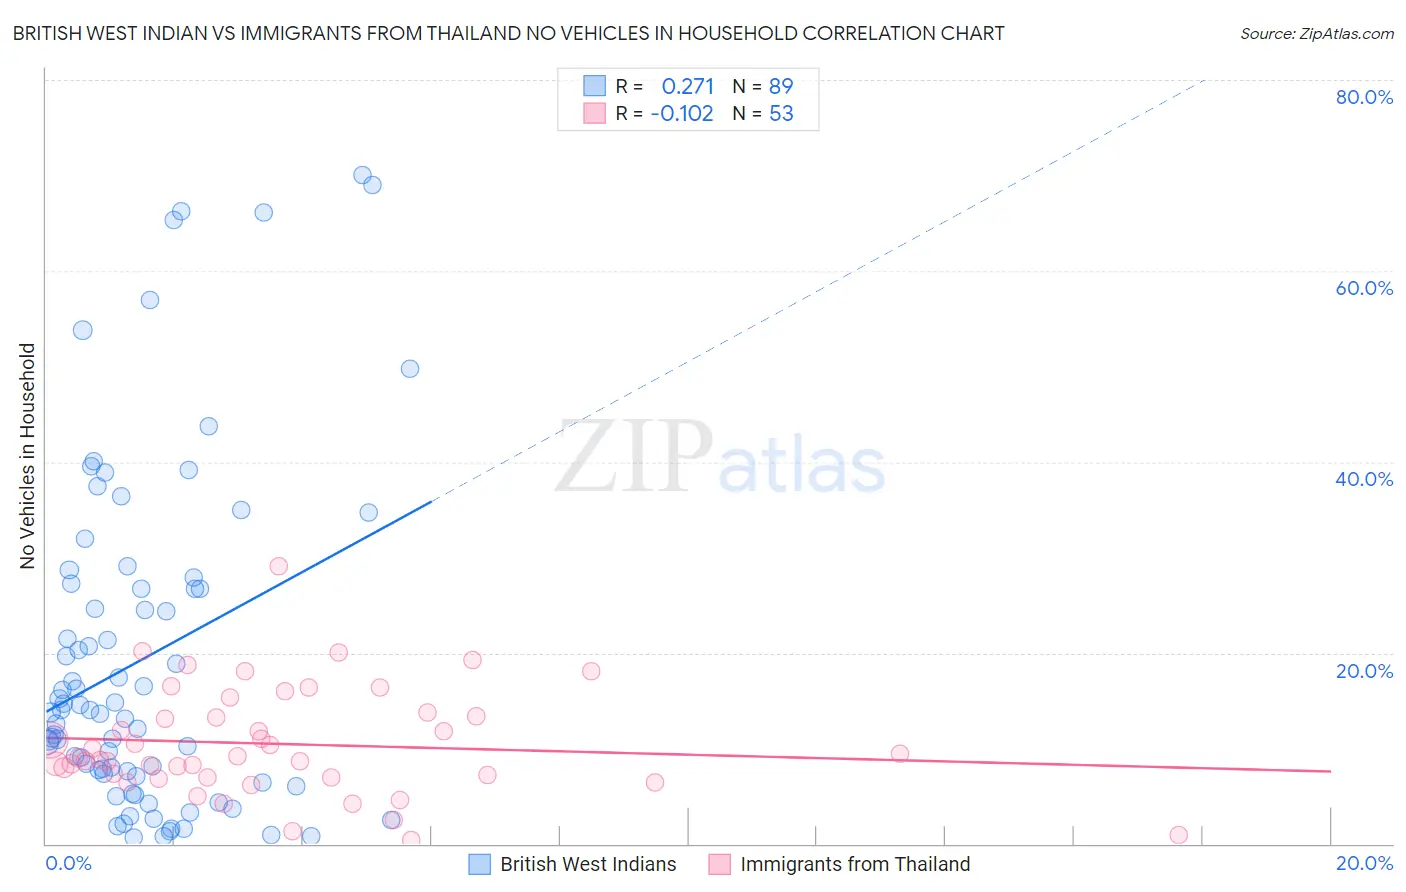
British West Indian vs Immigrants from Thailand No Vehicles in Household Correlation Chart
The statistical analysis conducted on geographies consisting of 152,511,245 people shows a weak positive correlation between the proportion of British West Indians and percentage of households with no vehicle available in the United States with a correlation coefficient (R) of 0.271 and weighted average of 29.7%. Similarly, the statistical analysis conducted on geographies consisting of 316,566,006 people shows a poor negative correlation between the proportion of Immigrants from Thailand and percentage of households with no vehicle available in the United States with a correlation coefficient (R) of -0.102 and weighted average of 9.5%, a difference of 212.6%.
No Vehicles in Household Correlation Summary
| Measurement | British West Indian | Immigrants from Thailand |
| Minimum | 0.70% | 0.37% |
| Maximum | 70.0% | 29.0% |
| Range | 69.3% | 28.6% |
| Mean | 19.4% | 10.5% |
| Median | 14.1% | 9.0% |
| Interquartile 25% (IQ1) | 7.2% | 6.9% |
| Interquartile 75% (IQ3) | 27.0% | 13.5% |
| Interquartile Range (IQR) | 19.9% | 6.6% |
| Standard Deviation (Sample) | 17.5% | 5.6% |
| Standard Deviation (Population) | 17.4% | 5.5% |
Similar Demographics by No Vehicles in Household
Demographics Similar to British West Indians by No Vehicles in Household
In terms of no vehicles in household, the demographic groups most similar to British West Indians are Inupiat (29.9%, a difference of 0.41%), Immigrants from Guyana (29.5%, a difference of 0.85%), Immigrants from Barbados (29.5%, a difference of 0.90%), Dominican (29.4%, a difference of 1.1%), and Guyanese (29.3%, a difference of 1.5%).
| Demographics | Rating | Rank | No Vehicles in Household |
| Immigrants | Trinidad and Tobago | 0.0 /100 | #333 | Tragic 24.6% |
| Immigrants | Bangladesh | 0.0 /100 | #334 | Tragic 25.8% |
| Barbadians | 0.0 /100 | #335 | Tragic 26.1% |
| Vietnamese | 0.0 /100 | #336 | Tragic 26.2% |
| Immigrants | Uzbekistan | 0.0 /100 | #337 | Tragic 26.7% |
| Guyanese | 0.0 /100 | #338 | Tragic 29.3% |
| Dominicans | 0.0 /100 | #339 | Tragic 29.4% |
| Immigrants | Barbados | 0.0 /100 | #340 | Tragic 29.5% |
| Immigrants | Guyana | 0.0 /100 | #341 | Tragic 29.5% |
| British West Indians | 0.0 /100 | #342 | Tragic 29.7% |
| Inupiat | 0.0 /100 | #343 | Tragic 29.9% |
| Immigrants | Dominican Republic | 0.0 /100 | #344 | Tragic 31.4% |
| Immigrants | St. Vincent and the Grenadines | 0.0 /100 | #345 | Tragic 35.4% |
| Immigrants | Grenada | 0.0 /100 | #346 | Tragic 37.5% |
| Yup'ik | 0.0 /100 | #347 | Tragic 45.9% |
Demographics Similar to Immigrants from Thailand by No Vehicles in Household
In terms of no vehicles in household, the demographic groups most similar to Immigrants from Thailand are Fijian (9.5%, a difference of 0.060%), Puget Sound Salish (9.5%, a difference of 0.10%), Costa Rican (9.5%, a difference of 0.15%), Greek (9.5%, a difference of 0.17%), and Blackfeet (9.6%, a difference of 0.61%).
| Demographics | Rating | Rank | No Vehicles in Household |
| Immigrants | Netherlands | 94.8 /100 | #113 | Exceptional 9.4% |
| Serbians | 94.3 /100 | #114 | Exceptional 9.4% |
| Navajo | 94.2 /100 | #115 | Exceptional 9.4% |
| Japanese | 94.1 /100 | #116 | Exceptional 9.4% |
| Chippewa | 93.8 /100 | #117 | Exceptional 9.4% |
| Greeks | 92.9 /100 | #118 | Exceptional 9.5% |
| Fijians | 92.7 /100 | #119 | Exceptional 9.5% |
| Immigrants | Thailand | 92.6 /100 | #120 | Exceptional 9.5% |
| Puget Sound Salish | 92.4 /100 | #121 | Exceptional 9.5% |
| Costa Ricans | 92.3 /100 | #122 | Exceptional 9.5% |
| Blackfeet | 91.4 /100 | #123 | Exceptional 9.6% |
| Immigrants | Korea | 90.9 /100 | #124 | Exceptional 9.6% |
| Immigrants | Cameroon | 90.6 /100 | #125 | Exceptional 9.6% |
| Icelanders | 90.2 /100 | #126 | Exceptional 9.6% |
| Immigrants | Kenya | 89.7 /100 | #127 | Excellent 9.6% |