British West Indian vs Immigrants from Denmark No Vehicles in Household
COMPARE
British West Indian
Immigrants from Denmark
No Vehicles in Household
No Vehicles in Household Comparison
British West Indians
Immigrants from Denmark
29.7%
NO VEHICLES IN HOUSEHOLD
0.0/ 100
METRIC RATING
342nd/ 347
METRIC RANK
11.1%
NO VEHICLES IN HOUSEHOLD
12.1/ 100
METRIC RATING
214th/ 347
METRIC RANK
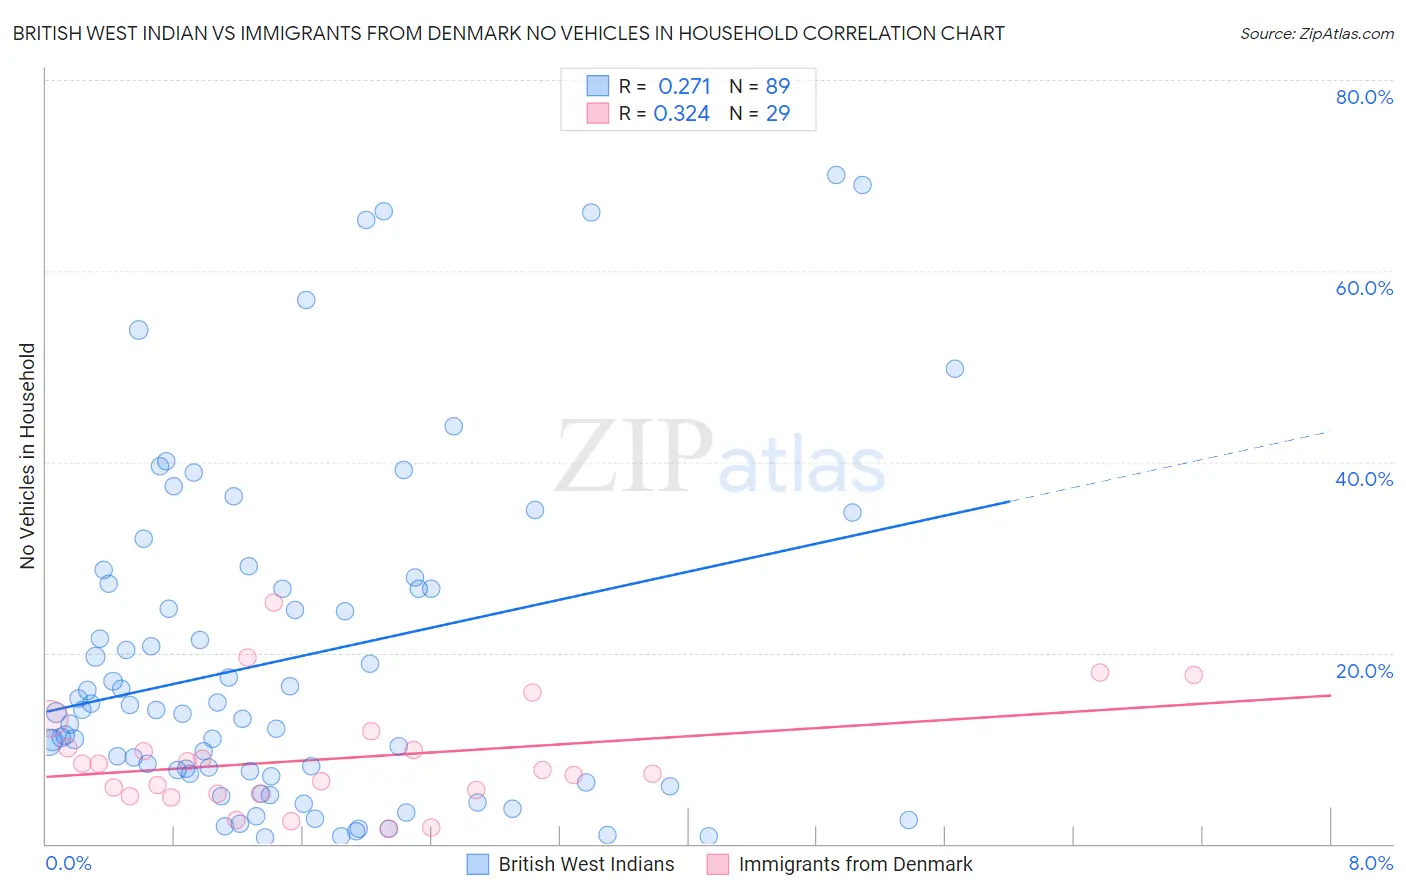
British West Indian vs Immigrants from Denmark No Vehicles in Household Correlation Chart
The statistical analysis conducted on geographies consisting of 152,511,245 people shows a weak positive correlation between the proportion of British West Indians and percentage of households with no vehicle available in the United States with a correlation coefficient (R) of 0.271 and weighted average of 29.7%. Similarly, the statistical analysis conducted on geographies consisting of 136,239,096 people shows a mild positive correlation between the proportion of Immigrants from Denmark and percentage of households with no vehicle available in the United States with a correlation coefficient (R) of 0.324 and weighted average of 11.1%, a difference of 167.9%.
No Vehicles in Household Correlation Summary
| Measurement | British West Indian | Immigrants from Denmark |
| Minimum | 0.70% | 1.5% |
| Maximum | 70.0% | 25.2% |
| Range | 69.3% | 23.7% |
| Mean | 19.4% | 9.0% |
| Median | 14.1% | 7.7% |
| Interquartile 25% (IQ1) | 7.2% | 5.2% |
| Interquartile 75% (IQ3) | 27.0% | 10.9% |
| Interquartile Range (IQR) | 19.9% | 5.7% |
| Standard Deviation (Sample) | 17.5% | 5.7% |
| Standard Deviation (Population) | 17.4% | 5.6% |
Similar Demographics by No Vehicles in Household
Demographics Similar to British West Indians by No Vehicles in Household
In terms of no vehicles in household, the demographic groups most similar to British West Indians are Inupiat (29.9%, a difference of 0.41%), Immigrants from Guyana (29.5%, a difference of 0.85%), Immigrants from Barbados (29.5%, a difference of 0.90%), Dominican (29.4%, a difference of 1.1%), and Guyanese (29.3%, a difference of 1.5%).
| Demographics | Rating | Rank | No Vehicles in Household |
| Immigrants | Trinidad and Tobago | 0.0 /100 | #333 | Tragic 24.6% |
| Immigrants | Bangladesh | 0.0 /100 | #334 | Tragic 25.8% |
| Barbadians | 0.0 /100 | #335 | Tragic 26.1% |
| Vietnamese | 0.0 /100 | #336 | Tragic 26.2% |
| Immigrants | Uzbekistan | 0.0 /100 | #337 | Tragic 26.7% |
| Guyanese | 0.0 /100 | #338 | Tragic 29.3% |
| Dominicans | 0.0 /100 | #339 | Tragic 29.4% |
| Immigrants | Barbados | 0.0 /100 | #340 | Tragic 29.5% |
| Immigrants | Guyana | 0.0 /100 | #341 | Tragic 29.5% |
| British West Indians | 0.0 /100 | #342 | Tragic 29.7% |
| Inupiat | 0.0 /100 | #343 | Tragic 29.9% |
| Immigrants | Dominican Republic | 0.0 /100 | #344 | Tragic 31.4% |
| Immigrants | St. Vincent and the Grenadines | 0.0 /100 | #345 | Tragic 35.4% |
| Immigrants | Grenada | 0.0 /100 | #346 | Tragic 37.5% |
| Yup'ik | 0.0 /100 | #347 | Tragic 45.9% |
Demographics Similar to Immigrants from Denmark by No Vehicles in Household
In terms of no vehicles in household, the demographic groups most similar to Immigrants from Denmark are Immigrants from Hungary (11.1%, a difference of 0.070%), Immigrants from Sri Lanka (11.2%, a difference of 0.46%), Immigrants from Argentina (11.2%, a difference of 0.46%), Immigrants from Western Asia (11.0%, a difference of 0.51%), and Crow (11.0%, a difference of 0.59%).
| Demographics | Rating | Rank | No Vehicles in Household |
| Sierra Leoneans | 15.7 /100 | #207 | Poor 11.0% |
| Immigrants | Italy | 15.6 /100 | #208 | Poor 11.0% |
| Pennsylvania Germans | 15.5 /100 | #209 | Poor 11.0% |
| Apache | 14.8 /100 | #210 | Poor 11.0% |
| Crow | 14.2 /100 | #211 | Poor 11.0% |
| Immigrants | Western Asia | 13.9 /100 | #212 | Poor 11.0% |
| Immigrants | Hungary | 12.3 /100 | #213 | Poor 11.1% |
| Immigrants | Denmark | 12.1 /100 | #214 | Poor 11.1% |
| Immigrants | Sri Lanka | 10.6 /100 | #215 | Poor 11.2% |
| Immigrants | Argentina | 10.6 /100 | #216 | Poor 11.2% |
| Dutch West Indians | 10.2 /100 | #217 | Poor 11.2% |
| Immigrants | Guatemala | 10.0 /100 | #218 | Tragic 11.2% |
| Argentineans | 9.6 /100 | #219 | Tragic 11.2% |
| Immigrants | Zaire | 9.6 /100 | #220 | Tragic 11.2% |
| Peruvians | 8.4 /100 | #221 | Tragic 11.2% |