Zip Codes with the Highest Percentage of Population Employed in Installation, Maintenance & Repair in Herndon, VA
RELATED REPORTS & OPTIONS
Installation, Maintenance & Repair
Herndon
Compare Zip Codes
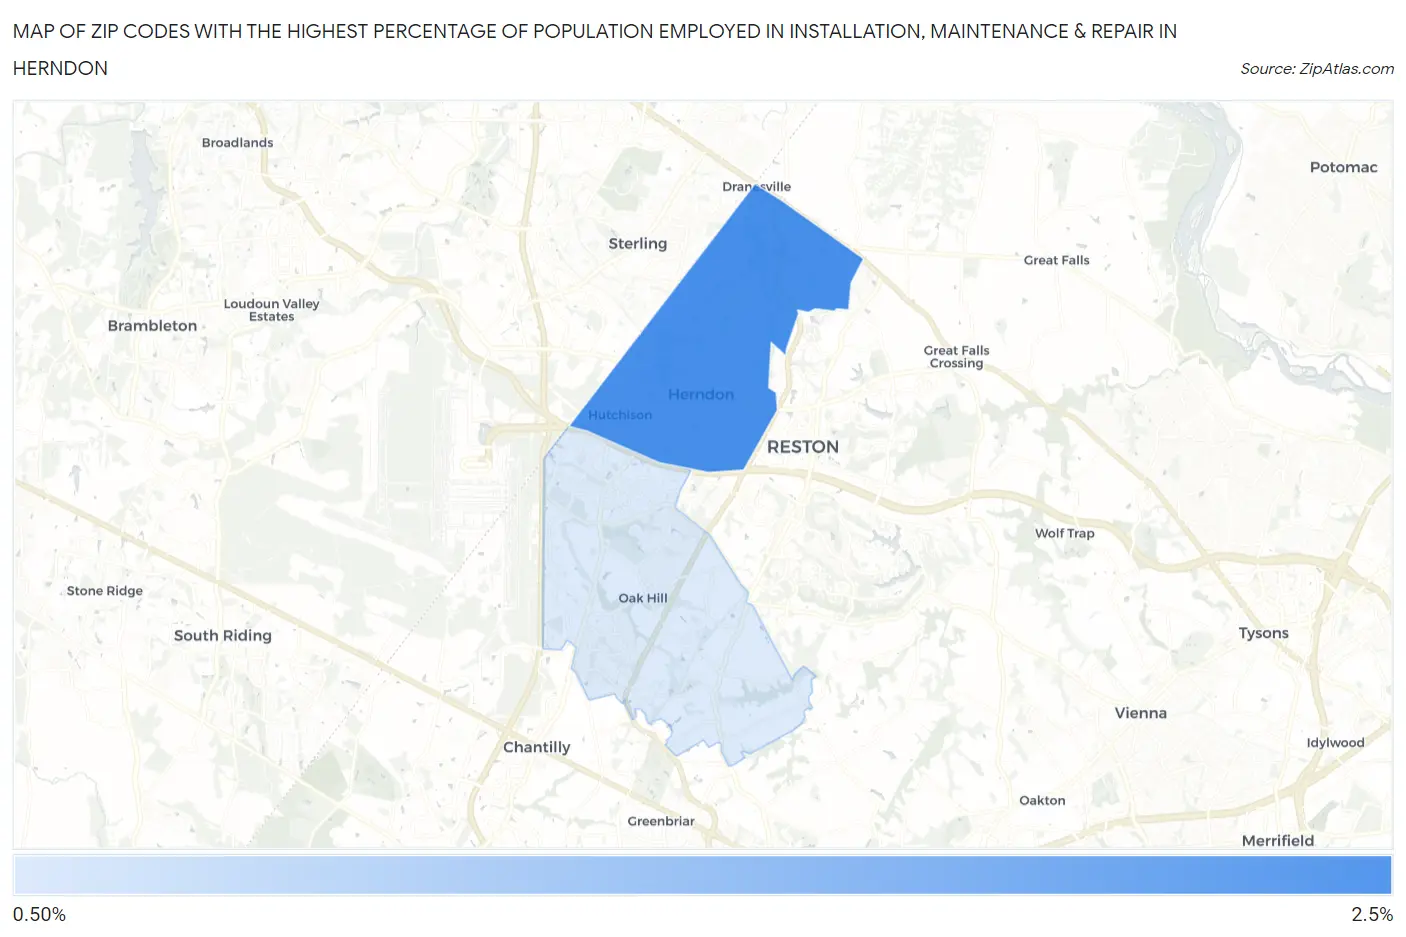
Map of Zip Codes with the Highest Percentage of Population Employed in Installation, Maintenance & Repair in Herndon
0.83%
2.0%
Zip Codes with the Highest Percentage of Population Employed in Installation, Maintenance & Repair in Herndon, VA
| Zip Code | % Employed | vs State | vs National | |
| 1. | 20170 | 2.0% | 2.9%(-0.877)#544 | 3.1%(-1.04)#21,898 |
| 2. | 20171 | 0.83% | 2.9%(-2.07)#659 | 3.1%(-2.23)#26,382 |
1
Common Questions
What are the Top Zip Codes with the Highest Percentage of Population Employed in Installation, Maintenance & Repair in Herndon, VA?
Top Zip Codes with the Highest Percentage of Population Employed in Installation, Maintenance & Repair in Herndon, VA are:
What zip code has the Highest Percentage of Population Employed in Installation, Maintenance & Repair in Herndon, VA?
20170 has the Highest Percentage of Population Employed in Installation, Maintenance & Repair in Herndon, VA with 2.0%.
What is the Percentage of Population Employed in Installation, Maintenance & Repair in Herndon, VA?
Percentage of Population Employed in Installation, Maintenance & Repair in Herndon is 2.0%.
What is the Percentage of Population Employed in Installation, Maintenance & Repair in Virginia?
Percentage of Population Employed in Installation, Maintenance & Repair in Virginia is 2.9%.
What is the Percentage of Population Employed in Installation, Maintenance & Repair in the United States?
Percentage of Population Employed in Installation, Maintenance & Repair in the United States is 3.1%.