Ukrainian vs Inupiat Unemployment Among Ages 35 to 44 years
COMPARE
Ukrainian
Inupiat
Unemployment Among Ages 35 to 44 years
Unemployment Among Ages 35 to 44 years Comparison
Ukrainians
Inupiat
4.6%
UNEMPLOYMENT AMONG AGES 35 TO 44 YEARS
75.8/ 100
METRIC RATING
142nd/ 347
METRIC RANK
8.6%
UNEMPLOYMENT AMONG AGES 35 TO 44 YEARS
0.0/ 100
METRIC RATING
339th/ 347
METRIC RANK
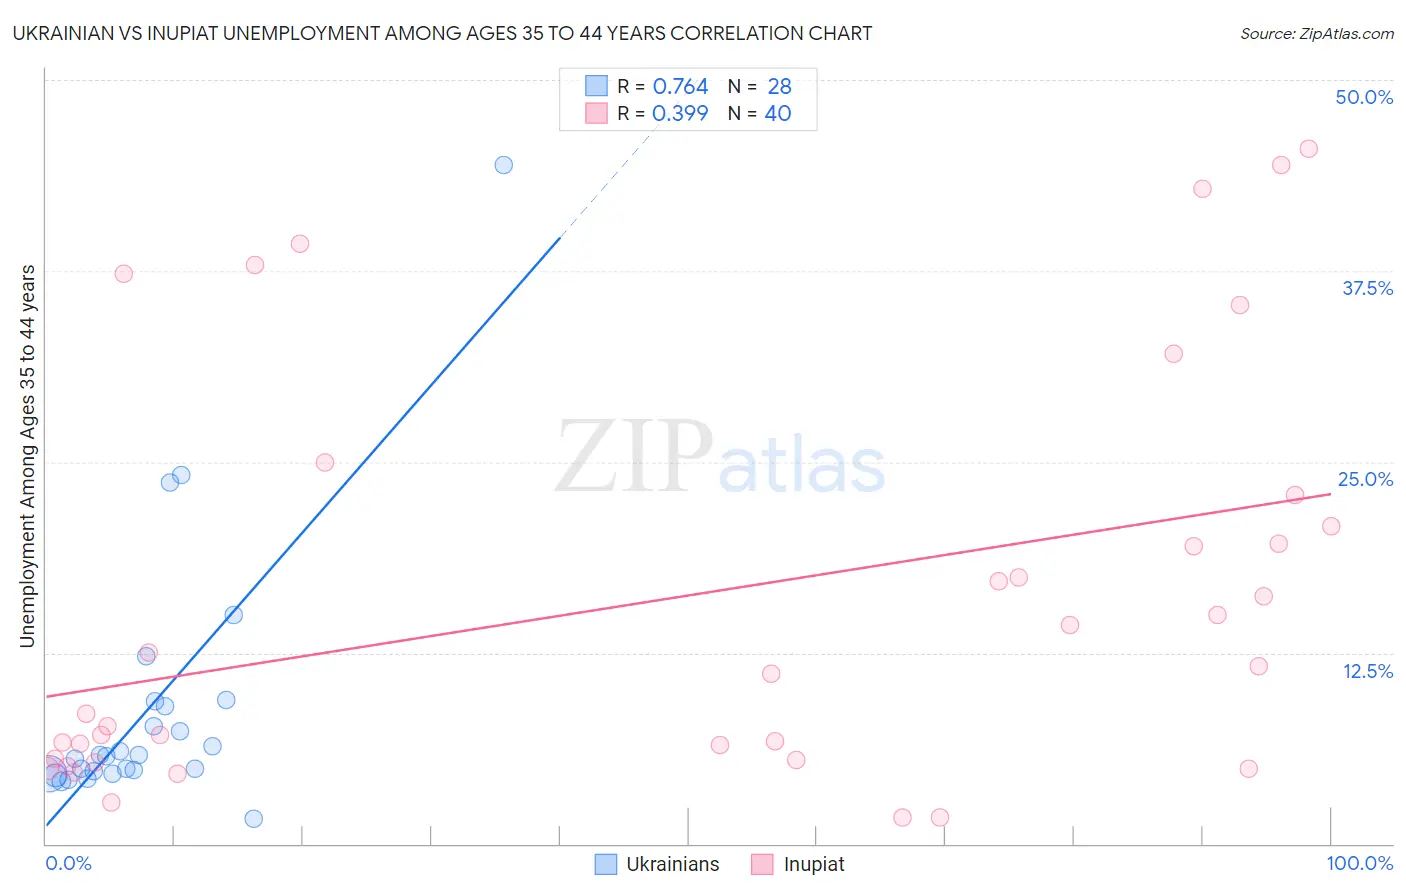
Ukrainian vs Inupiat Unemployment Among Ages 35 to 44 years Correlation Chart
The statistical analysis conducted on geographies consisting of 432,289,403 people shows a strong positive correlation between the proportion of Ukrainians and unemployment rate among population between the ages 35 and 44 in the United States with a correlation coefficient (R) of 0.764 and weighted average of 4.6%. Similarly, the statistical analysis conducted on geographies consisting of 95,589,628 people shows a mild positive correlation between the proportion of Inupiat and unemployment rate among population between the ages 35 and 44 in the United States with a correlation coefficient (R) of 0.399 and weighted average of 8.6%, a difference of 86.6%.
Unemployment Among Ages 35 to 44 years Correlation Summary
| Measurement | Ukrainian | Inupiat |
| Minimum | 1.6% | 1.7% |
| Maximum | 44.4% | 45.5% |
| Range | 42.8% | 43.8% |
| Mean | 8.9% | 16.0% |
| Median | 5.7% | 11.4% |
| Interquartile 25% (IQ1) | 4.7% | 5.5% |
| Interquartile 75% (IQ3) | 9.1% | 21.8% |
| Interquartile Range (IQR) | 4.5% | 16.3% |
| Standard Deviation (Sample) | 8.8% | 13.3% |
| Standard Deviation (Population) | 8.6% | 13.2% |
Similar Demographics by Unemployment Among Ages 35 to 44 years
Demographics Similar to Ukrainians by Unemployment Among Ages 35 to 44 years
In terms of unemployment among ages 35 to 44 years, the demographic groups most similar to Ukrainians are Canadian (4.6%, a difference of 0.010%), Immigrants from Eastern Africa (4.6%, a difference of 0.020%), Immigrants from Switzerland (4.6%, a difference of 0.030%), Immigrants from Russia (4.6%, a difference of 0.040%), and Immigrants from Hungary (4.6%, a difference of 0.050%).
| Demographics | Rating | Rank | Unemployment Among Ages 35 to 44 years |
| Immigrants | Europe | 79.4 /100 | #135 | Good 4.6% |
| Scotch-Irish | 79.3 /100 | #136 | Good 4.6% |
| Immigrants | Iraq | 78.9 /100 | #137 | Good 4.6% |
| Immigrants | Norway | 77.5 /100 | #138 | Good 4.6% |
| Immigrants | Hungary | 76.3 /100 | #139 | Good 4.6% |
| Immigrants | Eastern Africa | 76.0 /100 | #140 | Good 4.6% |
| Canadians | 75.9 /100 | #141 | Good 4.6% |
| Ukrainians | 75.8 /100 | #142 | Good 4.6% |
| Immigrants | Switzerland | 75.5 /100 | #143 | Good 4.6% |
| Immigrants | Russia | 75.4 /100 | #144 | Good 4.6% |
| Immigrants | Eastern Europe | 74.7 /100 | #145 | Good 4.6% |
| Immigrants | Denmark | 74.4 /100 | #146 | Good 4.6% |
| Immigrants | Vietnam | 73.8 /100 | #147 | Good 4.6% |
| Slavs | 72.4 /100 | #148 | Good 4.6% |
| Immigrants | Burma/Myanmar | 72.2 /100 | #149 | Good 4.6% |
Demographics Similar to Inupiat by Unemployment Among Ages 35 to 44 years
In terms of unemployment among ages 35 to 44 years, the demographic groups most similar to Inupiat are Alaskan Athabascan (8.6%, a difference of 0.69%), Cheyenne (8.5%, a difference of 1.1%), Tohono O'odham (8.4%, a difference of 1.6%), Apache (8.4%, a difference of 2.0%), and Sioux (8.4%, a difference of 2.3%).
| Demographics | Rating | Rank | Unemployment Among Ages 35 to 44 years |
| Natives/Alaskans | 0.0 /100 | #332 | Tragic 7.3% |
| Puerto Ricans | 0.0 /100 | #333 | Tragic 7.6% |
| Houma | 0.0 /100 | #334 | Tragic 7.8% |
| Sioux | 0.0 /100 | #335 | Tragic 8.4% |
| Apache | 0.0 /100 | #336 | Tragic 8.4% |
| Tohono O'odham | 0.0 /100 | #337 | Tragic 8.4% |
| Cheyenne | 0.0 /100 | #338 | Tragic 8.5% |
| Inupiat | 0.0 /100 | #339 | Tragic 8.6% |
| Alaskan Athabascans | 0.0 /100 | #340 | Tragic 8.6% |
| Hopi | 0.0 /100 | #341 | Tragic 8.9% |
| Navajo | 0.0 /100 | #342 | Tragic 9.3% |
| Arapaho | 0.0 /100 | #343 | Tragic 10.3% |
| Pima | 0.0 /100 | #344 | Tragic 11.8% |
| Yup'ik | 0.0 /100 | #345 | Tragic 14.4% |
| Crow | 0.0 /100 | #346 | Tragic 15.7% |