Immigrants from Austria vs Immigrants from Philippines Unemployment Among Ages 60 to 64 years
COMPARE
Immigrants from Austria
Immigrants from Philippines
Unemployment Among Ages 60 to 64 years
Unemployment Among Ages 60 to 64 years Comparison
Immigrants from Austria
Immigrants from Philippines
4.9%
UNEMPLOYMENT AMONG AGES 60 TO 64 YEARS
26.6/ 100
METRIC RATING
195th/ 347
METRIC RANK
5.0%
UNEMPLOYMENT AMONG AGES 60 TO 64 YEARS
1.9/ 100
METRIC RATING
243rd/ 347
METRIC RANK
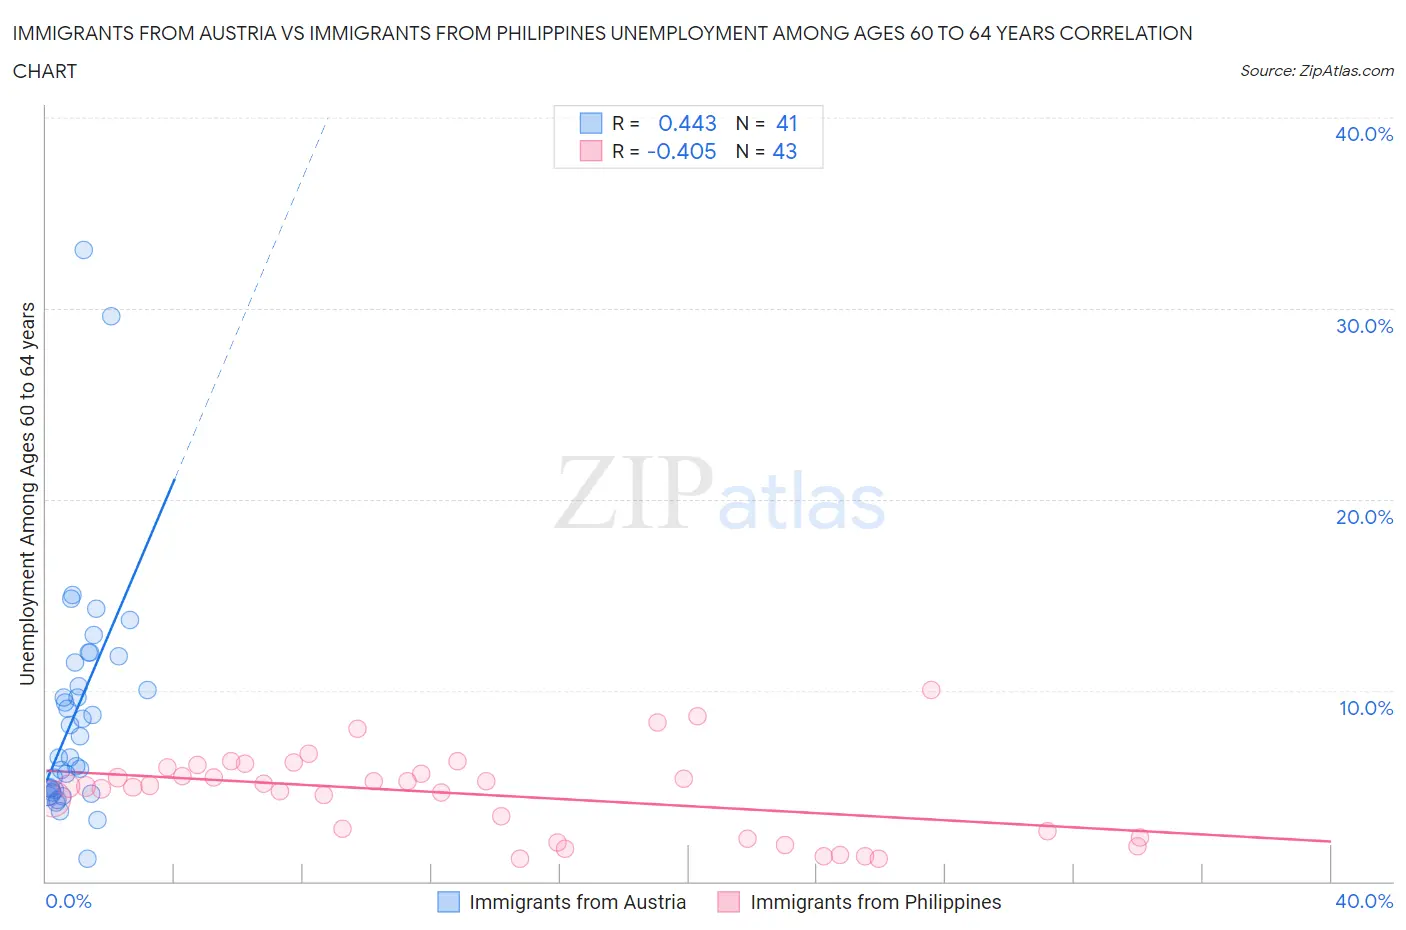
Immigrants from Austria vs Immigrants from Philippines Unemployment Among Ages 60 to 64 years Correlation Chart
The statistical analysis conducted on geographies consisting of 161,133,205 people shows a moderate positive correlation between the proportion of Immigrants from Austria and unemployment rate among population between the ages 60 and 64 in the United States with a correlation coefficient (R) of 0.443 and weighted average of 4.9%. Similarly, the statistical analysis conducted on geographies consisting of 416,041,447 people shows a moderate negative correlation between the proportion of Immigrants from Philippines and unemployment rate among population between the ages 60 and 64 in the United States with a correlation coefficient (R) of -0.405 and weighted average of 5.0%, a difference of 2.6%.
Unemployment Among Ages 60 to 64 years Correlation Summary
| Measurement | Immigrants from Austria | Immigrants from Philippines |
| Minimum | 1.2% | 1.2% |
| Maximum | 33.1% | 10.0% |
| Range | 31.9% | 8.8% |
| Mean | 8.9% | 4.6% |
| Median | 7.6% | 5.0% |
| Interquartile 25% (IQ1) | 4.7% | 2.3% |
| Interquartile 75% (IQ3) | 11.6% | 6.0% |
| Interquartile Range (IQR) | 6.9% | 3.7% |
| Standard Deviation (Sample) | 6.2% | 2.2% |
| Standard Deviation (Population) | 6.2% | 2.2% |
Similar Demographics by Unemployment Among Ages 60 to 64 years
Demographics Similar to Immigrants from Austria by Unemployment Among Ages 60 to 64 years
In terms of unemployment among ages 60 to 64 years, the demographic groups most similar to Immigrants from Austria are Immigrants from Colombia (4.9%, a difference of 0.010%), Immigrants from Asia (4.9%, a difference of 0.040%), Immigrants from Eastern Europe (4.9%, a difference of 0.070%), Houma (4.9%, a difference of 0.080%), and Menominee (4.9%, a difference of 0.10%).
| Demographics | Rating | Rank | Unemployment Among Ages 60 to 64 years |
| Nicaraguans | 30.4 /100 | #188 | Fair 4.9% |
| Immigrants | Nicaragua | 29.8 /100 | #189 | Fair 4.9% |
| Immigrants | Europe | 29.8 /100 | #190 | Fair 4.9% |
| Immigrants | Nigeria | 29.6 /100 | #191 | Fair 4.9% |
| Menominee | 28.8 /100 | #192 | Fair 4.9% |
| Houma | 28.3 /100 | #193 | Fair 4.9% |
| Immigrants | Colombia | 26.8 /100 | #194 | Fair 4.9% |
| Immigrants | Austria | 26.6 /100 | #195 | Fair 4.9% |
| Immigrants | Asia | 25.7 /100 | #196 | Fair 4.9% |
| Immigrants | Eastern Europe | 25.2 /100 | #197 | Fair 4.9% |
| Guamanians/Chamorros | 23.7 /100 | #198 | Fair 4.9% |
| Immigrants | Vietnam | 23.7 /100 | #199 | Fair 4.9% |
| Immigrants | Czechoslovakia | 23.5 /100 | #200 | Fair 4.9% |
| Colombians | 22.7 /100 | #201 | Fair 4.9% |
| Immigrants | Western Africa | 20.6 /100 | #202 | Fair 4.9% |
Demographics Similar to Immigrants from Philippines by Unemployment Among Ages 60 to 64 years
In terms of unemployment among ages 60 to 64 years, the demographic groups most similar to Immigrants from Philippines are Argentinean (5.0%, a difference of 0.10%), Peruvian (5.0%, a difference of 0.12%), Immigrants from Croatia (5.0%, a difference of 0.15%), Indian (Asian) (5.0%, a difference of 0.15%), and Ghanaian (5.0%, a difference of 0.23%).
| Demographics | Rating | Rank | Unemployment Among Ages 60 to 64 years |
| Immigrants | Sierra Leone | 3.1 /100 | #236 | Tragic 5.0% |
| Immigrants | Western Asia | 3.0 /100 | #237 | Tragic 5.0% |
| Immigrants | Poland | 3.0 /100 | #238 | Tragic 5.0% |
| Ghanaians | 2.4 /100 | #239 | Tragic 5.0% |
| Immigrants | Croatia | 2.2 /100 | #240 | Tragic 5.0% |
| Indians (Asian) | 2.2 /100 | #241 | Tragic 5.0% |
| Argentineans | 2.1 /100 | #242 | Tragic 5.0% |
| Immigrants | Philippines | 1.9 /100 | #243 | Tragic 5.0% |
| Peruvians | 1.6 /100 | #244 | Tragic 5.0% |
| Comanche | 1.3 /100 | #245 | Tragic 5.0% |
| Immigrants | South America | 1.1 /100 | #246 | Tragic 5.0% |
| Immigrants | North Macedonia | 1.1 /100 | #247 | Tragic 5.0% |
| Immigrants | Fiji | 1.1 /100 | #248 | Tragic 5.1% |
| South Americans | 1.0 /100 | #249 | Tragic 5.1% |
| Immigrants | Cambodia | 0.9 /100 | #250 | Tragic 5.1% |