Yup'ik vs Burmese Unemployment Among Ages 25 to 29 years
COMPARE
Yup'ik
Burmese
Unemployment Among Ages 25 to 29 years
Unemployment Among Ages 25 to 29 years Comparison
Yup'ik
Burmese
17.9%
UNEMPLOYMENT AMONG AGES 25 TO 29 YEARS
0.0/ 100
METRIC RATING
347th/ 347
METRIC RANK
6.2%
UNEMPLOYMENT AMONG AGES 25 TO 29 YEARS
98.9/ 100
METRIC RATING
51st/ 347
METRIC RANK
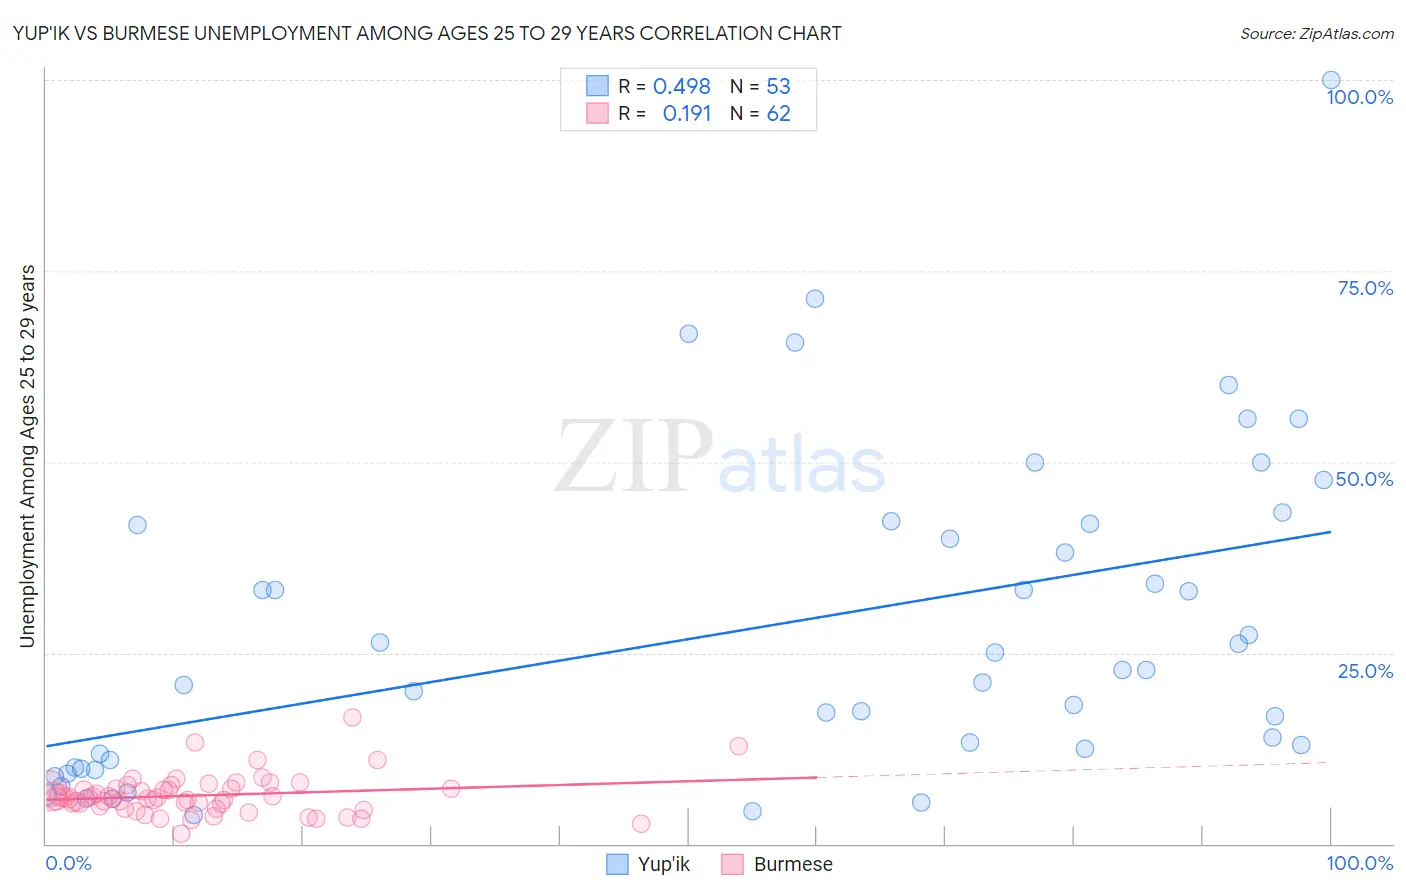
Yup'ik vs Burmese Unemployment Among Ages 25 to 29 years Correlation Chart
The statistical analysis conducted on geographies consisting of 39,381,605 people shows a moderate positive correlation between the proportion of Yup'ik and unemployment rate among population between the ages 25 and 29 in the United States with a correlation coefficient (R) of 0.498 and weighted average of 17.9%. Similarly, the statistical analysis conducted on geographies consisting of 436,526,024 people shows a poor positive correlation between the proportion of Burmese and unemployment rate among population between the ages 25 and 29 in the United States with a correlation coefficient (R) of 0.191 and weighted average of 6.2%, a difference of 189.5%.
Unemployment Among Ages 25 to 29 years Correlation Summary
| Measurement | Yup'ik | Burmese |
| Minimum | 3.8% | 1.3% |
| Maximum | 100.0% | 16.6% |
| Range | 96.2% | 15.3% |
| Mean | 28.1% | 6.3% |
| Median | 22.7% | 6.0% |
| Interquartile 25% (IQ1) | 10.5% | 4.9% |
| Interquartile 75% (IQ3) | 41.8% | 7.2% |
| Interquartile Range (IQR) | 31.3% | 2.3% |
| Standard Deviation (Sample) | 21.0% | 2.6% |
| Standard Deviation (Population) | 20.8% | 2.6% |
Similar Demographics by Unemployment Among Ages 25 to 29 years
Demographics Similar to Yup'ik by Unemployment Among Ages 25 to 29 years
In terms of unemployment among ages 25 to 29 years, the demographic groups most similar to Yup'ik are Crow (15.4%, a difference of 16.6%), Arapaho (15.4%, a difference of 16.6%), Hopi (13.5%, a difference of 32.6%), Inupiat (13.4%, a difference of 33.4%), and Navajo (12.2%, a difference of 47.2%).
| Demographics | Rating | Rank | Unemployment Among Ages 25 to 29 years |
| Alaskan Athabascans | 0.0 /100 | #333 | Tragic 10.8% |
| Yuman | 0.0 /100 | #334 | Tragic 11.0% |
| Puerto Ricans | 0.0 /100 | #335 | Tragic 11.1% |
| Lumbee | 0.0 /100 | #336 | Tragic 11.2% |
| Menominee | 0.0 /100 | #337 | Tragic 11.3% |
| Sioux | 0.0 /100 | #338 | Tragic 11.7% |
| Pima | 0.0 /100 | #339 | Tragic 11.8% |
| Cheyenne | 0.0 /100 | #340 | Tragic 11.8% |
| Tohono O'odham | 0.0 /100 | #341 | Tragic 12.1% |
| Navajo | 0.0 /100 | #342 | Tragic 12.2% |
| Inupiat | 0.0 /100 | #343 | Tragic 13.4% |
| Hopi | 0.0 /100 | #344 | Tragic 13.5% |
| Arapaho | 0.0 /100 | #345 | Tragic 15.4% |
| Crow | 0.0 /100 | #346 | Tragic 15.4% |
| Yup'ik | 0.0 /100 | #347 | Tragic 17.9% |
Demographics Similar to Burmese by Unemployment Among Ages 25 to 29 years
In terms of unemployment among ages 25 to 29 years, the demographic groups most similar to Burmese are Soviet Union (6.2%, a difference of 0.030%), Immigrants from Turkey (6.2%, a difference of 0.050%), German Russian (6.2%, a difference of 0.090%), Turkish (6.2%, a difference of 0.11%), and Swedish (6.2%, a difference of 0.12%).
| Demographics | Rating | Rank | Unemployment Among Ages 25 to 29 years |
| Mongolians | 99.2 /100 | #44 | Exceptional 6.2% |
| Venezuelans | 99.1 /100 | #45 | Exceptional 6.2% |
| Immigrants | Lithuania | 99.0 /100 | #46 | Exceptional 6.2% |
| Latvians | 99.0 /100 | #47 | Exceptional 6.2% |
| Immigrants | Australia | 99.0 /100 | #48 | Exceptional 6.2% |
| German Russians | 99.0 /100 | #49 | Exceptional 6.2% |
| Soviet Union | 98.9 /100 | #50 | Exceptional 6.2% |
| Burmese | 98.9 /100 | #51 | Exceptional 6.2% |
| Immigrants | Turkey | 98.9 /100 | #52 | Exceptional 6.2% |
| Turks | 98.8 /100 | #53 | Exceptional 6.2% |
| Swedes | 98.8 /100 | #54 | Exceptional 6.2% |
| Immigrants | Netherlands | 98.7 /100 | #55 | Exceptional 6.2% |
| Immigrants | Burma/Myanmar | 98.7 /100 | #56 | Exceptional 6.2% |
| Immigrants | Saudi Arabia | 98.6 /100 | #57 | Exceptional 6.2% |
| Immigrants | Eastern Asia | 98.4 /100 | #58 | Exceptional 6.2% |