Paiute vs Burmese Unemployment Among Ages 25 to 29 years
COMPARE
Paiute
Burmese
Unemployment Among Ages 25 to 29 years
Unemployment Among Ages 25 to 29 years Comparison
Paiute
Burmese
7.4%
UNEMPLOYMENT AMONG AGES 25 TO 29 YEARS
0.1/ 100
METRIC RATING
266th/ 347
METRIC RANK
6.2%
UNEMPLOYMENT AMONG AGES 25 TO 29 YEARS
98.9/ 100
METRIC RATING
51st/ 347
METRIC RANK
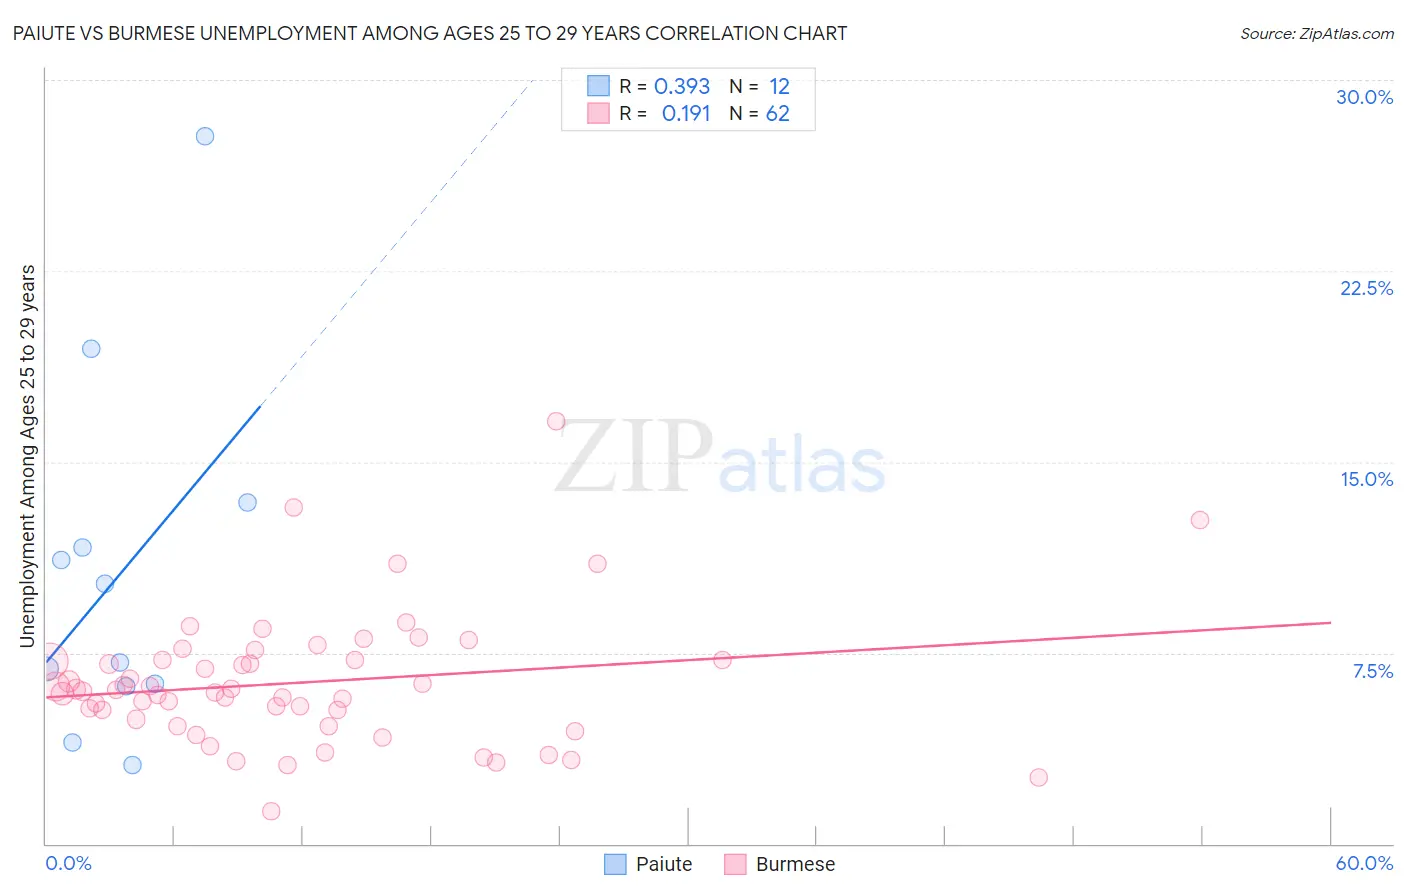
Paiute vs Burmese Unemployment Among Ages 25 to 29 years Correlation Chart
The statistical analysis conducted on geographies consisting of 57,773,111 people shows a mild positive correlation between the proportion of Paiute and unemployment rate among population between the ages 25 and 29 in the United States with a correlation coefficient (R) of 0.393 and weighted average of 7.4%. Similarly, the statistical analysis conducted on geographies consisting of 436,526,024 people shows a poor positive correlation between the proportion of Burmese and unemployment rate among population between the ages 25 and 29 in the United States with a correlation coefficient (R) of 0.191 and weighted average of 6.2%, a difference of 19.7%.
Unemployment Among Ages 25 to 29 years Correlation Summary
| Measurement | Paiute | Burmese |
| Minimum | 3.1% | 1.3% |
| Maximum | 27.8% | 16.6% |
| Range | 24.7% | 15.3% |
| Mean | 10.6% | 6.3% |
| Median | 8.7% | 6.0% |
| Interquartile 25% (IQ1) | 6.2% | 4.9% |
| Interquartile 75% (IQ3) | 12.5% | 7.2% |
| Interquartile Range (IQR) | 6.3% | 2.3% |
| Standard Deviation (Sample) | 7.1% | 2.6% |
| Standard Deviation (Population) | 6.8% | 2.6% |
Similar Demographics by Unemployment Among Ages 25 to 29 years
Demographics Similar to Paiute by Unemployment Among Ages 25 to 29 years
In terms of unemployment among ages 25 to 29 years, the demographic groups most similar to Paiute are Pennsylvania German (7.4%, a difference of 0.070%), Immigrants from Ecuador (7.4%, a difference of 0.090%), Immigrants from Fiji (7.4%, a difference of 0.14%), Immigrants from Latin America (7.4%, a difference of 0.15%), and Immigrants from Western Africa (7.4%, a difference of 0.21%).
| Demographics | Rating | Rank | Unemployment Among Ages 25 to 29 years |
| Cree | 0.1 /100 | #259 | Tragic 7.3% |
| Americans | 0.1 /100 | #260 | Tragic 7.4% |
| Nigerians | 0.1 /100 | #261 | Tragic 7.4% |
| Ecuadorians | 0.1 /100 | #262 | Tragic 7.4% |
| Kiowa | 0.1 /100 | #263 | Tragic 7.4% |
| Immigrants | Western Africa | 0.1 /100 | #264 | Tragic 7.4% |
| Immigrants | Fiji | 0.1 /100 | #265 | Tragic 7.4% |
| Paiute | 0.1 /100 | #266 | Tragic 7.4% |
| Pennsylvania Germans | 0.1 /100 | #267 | Tragic 7.4% |
| Immigrants | Ecuador | 0.1 /100 | #268 | Tragic 7.4% |
| Immigrants | Latin America | 0.1 /100 | #269 | Tragic 7.4% |
| Bahamians | 0.0 /100 | #270 | Tragic 7.5% |
| Choctaw | 0.0 /100 | #271 | Tragic 7.5% |
| Immigrants | Bahamas | 0.0 /100 | #272 | Tragic 7.5% |
| Immigrants | Nigeria | 0.0 /100 | #273 | Tragic 7.5% |
Demographics Similar to Burmese by Unemployment Among Ages 25 to 29 years
In terms of unemployment among ages 25 to 29 years, the demographic groups most similar to Burmese are Soviet Union (6.2%, a difference of 0.030%), Immigrants from Turkey (6.2%, a difference of 0.050%), German Russian (6.2%, a difference of 0.090%), Turkish (6.2%, a difference of 0.11%), and Swedish (6.2%, a difference of 0.12%).
| Demographics | Rating | Rank | Unemployment Among Ages 25 to 29 years |
| Mongolians | 99.2 /100 | #44 | Exceptional 6.2% |
| Venezuelans | 99.1 /100 | #45 | Exceptional 6.2% |
| Immigrants | Lithuania | 99.0 /100 | #46 | Exceptional 6.2% |
| Latvians | 99.0 /100 | #47 | Exceptional 6.2% |
| Immigrants | Australia | 99.0 /100 | #48 | Exceptional 6.2% |
| German Russians | 99.0 /100 | #49 | Exceptional 6.2% |
| Soviet Union | 98.9 /100 | #50 | Exceptional 6.2% |
| Burmese | 98.9 /100 | #51 | Exceptional 6.2% |
| Immigrants | Turkey | 98.9 /100 | #52 | Exceptional 6.2% |
| Turks | 98.8 /100 | #53 | Exceptional 6.2% |
| Swedes | 98.8 /100 | #54 | Exceptional 6.2% |
| Immigrants | Netherlands | 98.7 /100 | #55 | Exceptional 6.2% |
| Immigrants | Burma/Myanmar | 98.7 /100 | #56 | Exceptional 6.2% |
| Immigrants | Saudi Arabia | 98.6 /100 | #57 | Exceptional 6.2% |
| Immigrants | Eastern Asia | 98.4 /100 | #58 | Exceptional 6.2% |