Yup'ik vs Immigrants from El Salvador Unemployment Among Ages 25 to 29 years
COMPARE
Yup'ik
Immigrants from El Salvador
Unemployment Among Ages 25 to 29 years
Unemployment Among Ages 25 to 29 years Comparison
Yup'ik
Immigrants from El Salvador
17.9%
UNEMPLOYMENT AMONG AGES 25 TO 29 YEARS
0.0/ 100
METRIC RATING
347th/ 347
METRIC RANK
7.0%
UNEMPLOYMENT AMONG AGES 25 TO 29 YEARS
3.6/ 100
METRIC RATING
230th/ 347
METRIC RANK
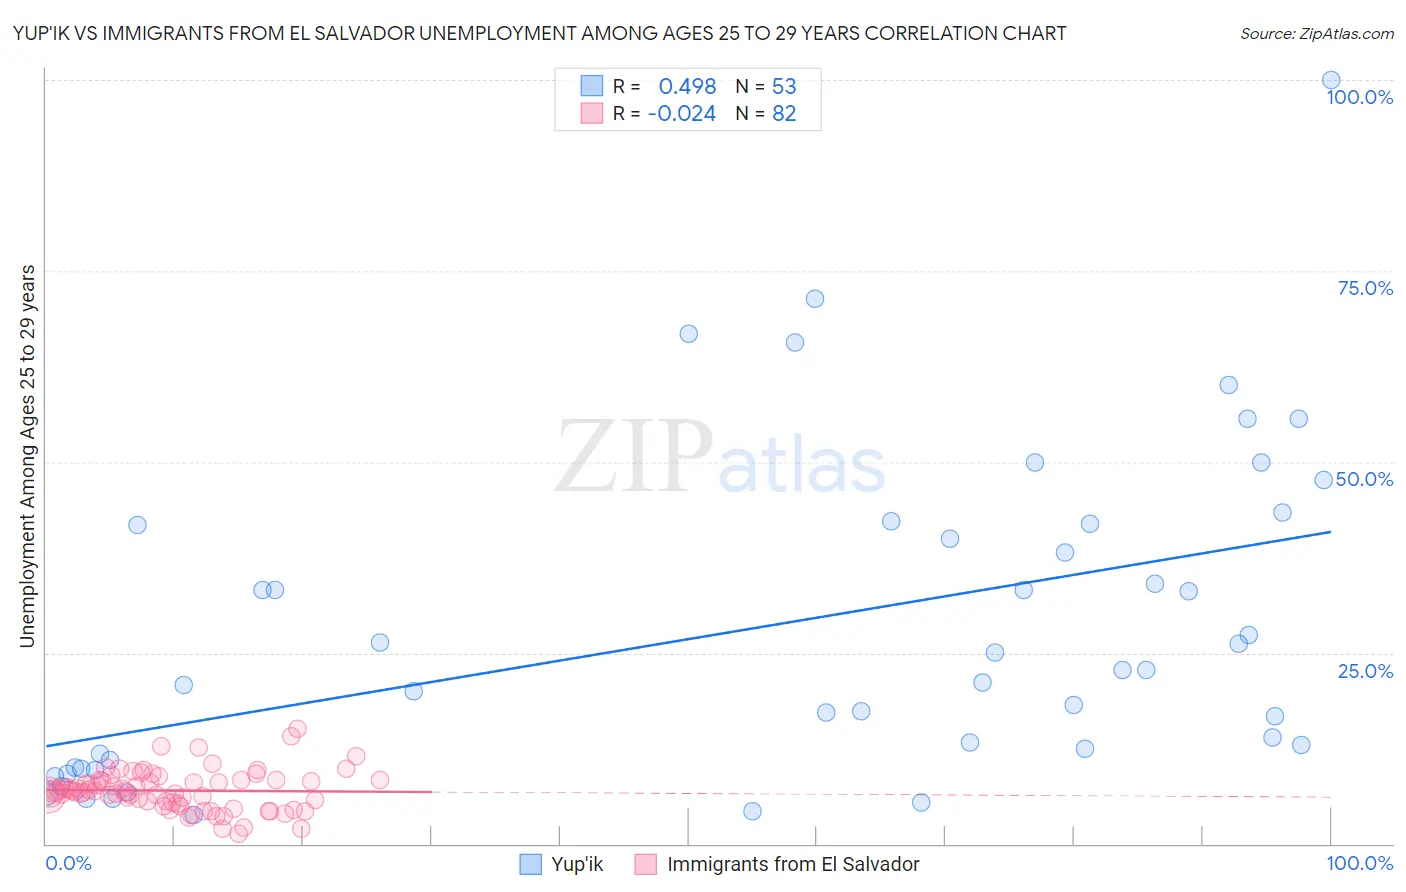
Yup'ik vs Immigrants from El Salvador Unemployment Among Ages 25 to 29 years Correlation Chart
The statistical analysis conducted on geographies consisting of 39,381,605 people shows a moderate positive correlation between the proportion of Yup'ik and unemployment rate among population between the ages 25 and 29 in the United States with a correlation coefficient (R) of 0.498 and weighted average of 17.9%. Similarly, the statistical analysis conducted on geographies consisting of 345,247,368 people shows no correlation between the proportion of Immigrants from El Salvador and unemployment rate among population between the ages 25 and 29 in the United States with a correlation coefficient (R) of -0.024 and weighted average of 7.0%, a difference of 156.5%.
Unemployment Among Ages 25 to 29 years Correlation Summary
| Measurement | Yup'ik | Immigrants from El Salvador |
| Minimum | 3.8% | 1.4% |
| Maximum | 100.0% | 15.1% |
| Range | 96.2% | 13.7% |
| Mean | 28.1% | 7.0% |
| Median | 22.7% | 6.8% |
| Interquartile 25% (IQ1) | 10.5% | 5.5% |
| Interquartile 75% (IQ3) | 41.8% | 8.3% |
| Interquartile Range (IQR) | 31.3% | 2.8% |
| Standard Deviation (Sample) | 21.0% | 2.6% |
| Standard Deviation (Population) | 20.8% | 2.6% |
Similar Demographics by Unemployment Among Ages 25 to 29 years
Demographics Similar to Yup'ik by Unemployment Among Ages 25 to 29 years
In terms of unemployment among ages 25 to 29 years, the demographic groups most similar to Yup'ik are Crow (15.4%, a difference of 16.6%), Arapaho (15.4%, a difference of 16.6%), Hopi (13.5%, a difference of 32.6%), Inupiat (13.4%, a difference of 33.4%), and Navajo (12.2%, a difference of 47.2%).
| Demographics | Rating | Rank | Unemployment Among Ages 25 to 29 years |
| Alaskan Athabascans | 0.0 /100 | #333 | Tragic 10.8% |
| Yuman | 0.0 /100 | #334 | Tragic 11.0% |
| Puerto Ricans | 0.0 /100 | #335 | Tragic 11.1% |
| Lumbee | 0.0 /100 | #336 | Tragic 11.2% |
| Menominee | 0.0 /100 | #337 | Tragic 11.3% |
| Sioux | 0.0 /100 | #338 | Tragic 11.7% |
| Pima | 0.0 /100 | #339 | Tragic 11.8% |
| Cheyenne | 0.0 /100 | #340 | Tragic 11.8% |
| Tohono O'odham | 0.0 /100 | #341 | Tragic 12.1% |
| Navajo | 0.0 /100 | #342 | Tragic 12.2% |
| Inupiat | 0.0 /100 | #343 | Tragic 13.4% |
| Hopi | 0.0 /100 | #344 | Tragic 13.5% |
| Arapaho | 0.0 /100 | #345 | Tragic 15.4% |
| Crow | 0.0 /100 | #346 | Tragic 15.4% |
| Yup'ik | 0.0 /100 | #347 | Tragic 17.9% |
Demographics Similar to Immigrants from El Salvador by Unemployment Among Ages 25 to 29 years
In terms of unemployment among ages 25 to 29 years, the demographic groups most similar to Immigrants from El Salvador are Bermudan (7.0%, a difference of 0.080%), Immigrants from Panama (7.0%, a difference of 0.23%), Salvadoran (7.0%, a difference of 0.29%), Central American (7.0%, a difference of 0.29%), and Immigrants from Liberia (7.0%, a difference of 0.42%).
| Demographics | Rating | Rank | Unemployment Among Ages 25 to 29 years |
| Celtics | 7.6 /100 | #223 | Tragic 6.9% |
| Immigrants | Immigrants | 6.2 /100 | #224 | Tragic 6.9% |
| Japanese | 5.4 /100 | #225 | Tragic 6.9% |
| Immigrants | Liberia | 4.8 /100 | #226 | Tragic 7.0% |
| Salvadorans | 4.4 /100 | #227 | Tragic 7.0% |
| Immigrants | Panama | 4.2 /100 | #228 | Tragic 7.0% |
| Bermudans | 3.8 /100 | #229 | Tragic 7.0% |
| Immigrants | El Salvador | 3.6 /100 | #230 | Tragic 7.0% |
| Central Americans | 3.0 /100 | #231 | Tragic 7.0% |
| Spanish Americans | 2.7 /100 | #232 | Tragic 7.0% |
| Immigrants | Honduras | 2.4 /100 | #233 | Tragic 7.0% |
| French Canadians | 2.4 /100 | #234 | Tragic 7.0% |
| Panamanians | 2.1 /100 | #235 | Tragic 7.0% |
| Cape Verdeans | 1.9 /100 | #236 | Tragic 7.0% |
| Puget Sound Salish | 1.8 /100 | #237 | Tragic 7.1% |