Immigrants from Kuwait vs Burmese Unemployment Among Ages 25 to 29 years
COMPARE
Immigrants from Kuwait
Burmese
Unemployment Among Ages 25 to 29 years
Unemployment Among Ages 25 to 29 years Comparison
Immigrants from Kuwait
Burmese
5.9%
UNEMPLOYMENT AMONG AGES 25 TO 29 YEARS
99.9/ 100
METRIC RATING
14th/ 347
METRIC RANK
6.2%
UNEMPLOYMENT AMONG AGES 25 TO 29 YEARS
98.9/ 100
METRIC RATING
51st/ 347
METRIC RANK
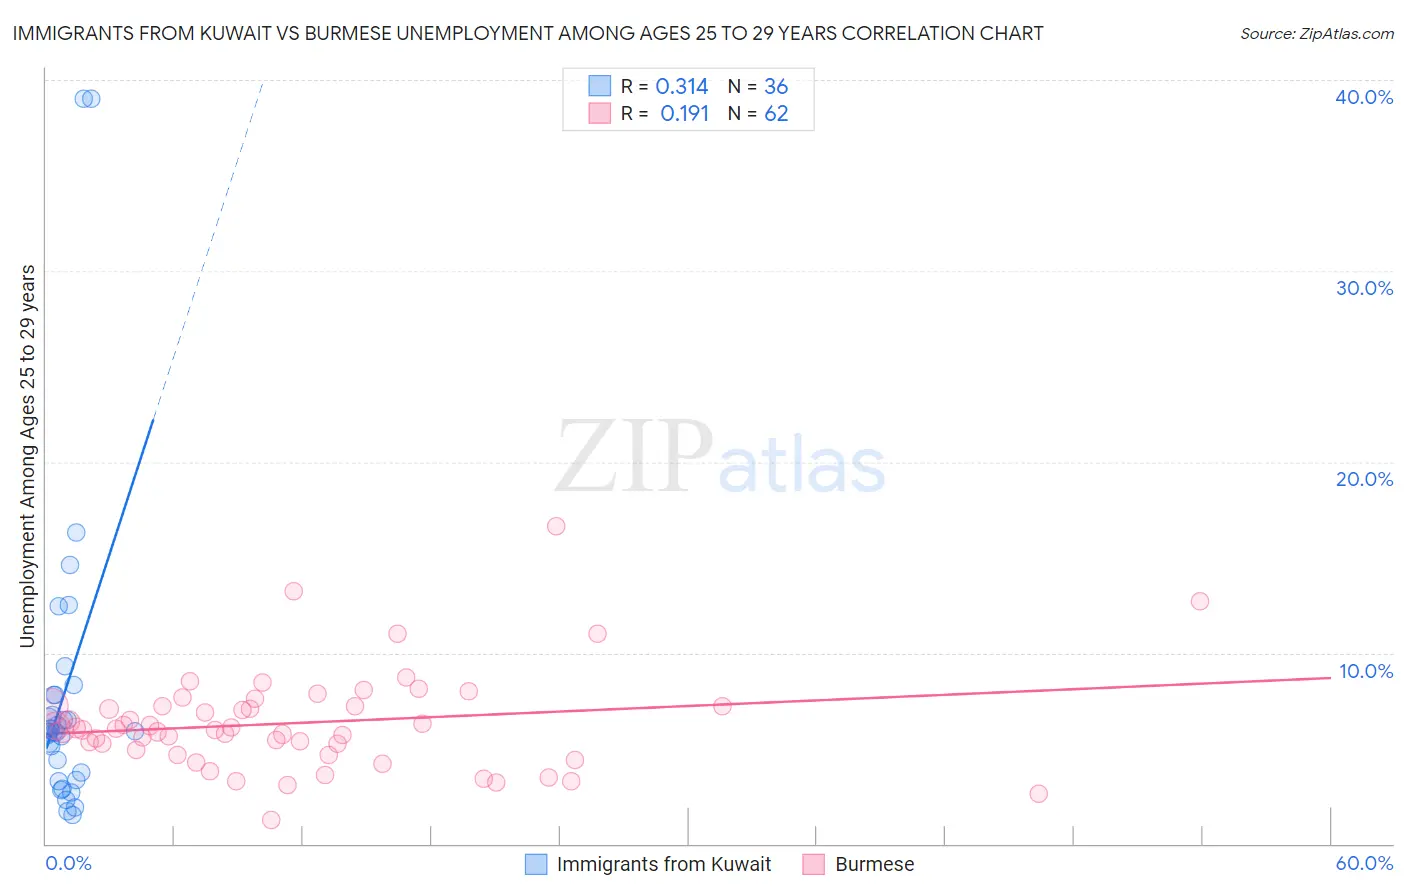
Immigrants from Kuwait vs Burmese Unemployment Among Ages 25 to 29 years Correlation Chart
The statistical analysis conducted on geographies consisting of 135,474,180 people shows a mild positive correlation between the proportion of Immigrants from Kuwait and unemployment rate among population between the ages 25 and 29 in the United States with a correlation coefficient (R) of 0.314 and weighted average of 5.9%. Similarly, the statistical analysis conducted on geographies consisting of 436,526,024 people shows a poor positive correlation between the proportion of Burmese and unemployment rate among population between the ages 25 and 29 in the United States with a correlation coefficient (R) of 0.191 and weighted average of 6.2%, a difference of 5.0%.
Unemployment Among Ages 25 to 29 years Correlation Summary
| Measurement | Immigrants from Kuwait | Burmese |
| Minimum | 1.5% | 1.3% |
| Maximum | 39.0% | 16.6% |
| Range | 37.5% | 15.3% |
| Mean | 8.0% | 6.3% |
| Median | 5.9% | 6.0% |
| Interquartile 25% (IQ1) | 3.5% | 4.9% |
| Interquartile 75% (IQ3) | 7.8% | 7.2% |
| Interquartile Range (IQR) | 4.3% | 2.3% |
| Standard Deviation (Sample) | 8.4% | 2.6% |
| Standard Deviation (Population) | 8.2% | 2.6% |
Similar Demographics by Unemployment Among Ages 25 to 29 years
Demographics Similar to Immigrants from Kuwait by Unemployment Among Ages 25 to 29 years
In terms of unemployment among ages 25 to 29 years, the demographic groups most similar to Immigrants from Kuwait are Cuban (5.9%, a difference of 0.35%), Immigrants from Bulgaria (5.9%, a difference of 0.36%), Bolivian (5.9%, a difference of 0.50%), Immigrants from Singapore (5.9%, a difference of 0.61%), and Immigrants from Bolivia (5.9%, a difference of 0.63%).
| Demographics | Rating | Rank | Unemployment Among Ages 25 to 29 years |
| Immigrants | India | 100.0 /100 | #7 | Exceptional 5.7% |
| Immigrants | Bosnia and Herzegovina | 100.0 /100 | #8 | Exceptional 5.7% |
| Immigrants | Nepal | 100.0 /100 | #9 | Exceptional 5.7% |
| Immigrants | Sudan | 100.0 /100 | #10 | Exceptional 5.8% |
| Cambodians | 100.0 /100 | #11 | Exceptional 5.8% |
| Okinawans | 100.0 /100 | #12 | Exceptional 5.9% |
| Immigrants | Bolivia | 100.0 /100 | #13 | Exceptional 5.9% |
| Immigrants | Kuwait | 99.9 /100 | #14 | Exceptional 5.9% |
| Cubans | 99.9 /100 | #15 | Exceptional 5.9% |
| Immigrants | Bulgaria | 99.9 /100 | #16 | Exceptional 5.9% |
| Bolivians | 99.9 /100 | #17 | Exceptional 5.9% |
| Immigrants | Singapore | 99.9 /100 | #18 | Exceptional 5.9% |
| Thais | 99.9 /100 | #19 | Exceptional 5.9% |
| Immigrants | Eritrea | 99.9 /100 | #20 | Exceptional 5.9% |
| Immigrants | Ethiopia | 99.9 /100 | #21 | Exceptional 6.0% |
Demographics Similar to Burmese by Unemployment Among Ages 25 to 29 years
In terms of unemployment among ages 25 to 29 years, the demographic groups most similar to Burmese are Soviet Union (6.2%, a difference of 0.030%), Immigrants from Turkey (6.2%, a difference of 0.050%), German Russian (6.2%, a difference of 0.090%), Turkish (6.2%, a difference of 0.11%), and Swedish (6.2%, a difference of 0.12%).
| Demographics | Rating | Rank | Unemployment Among Ages 25 to 29 years |
| Mongolians | 99.2 /100 | #44 | Exceptional 6.2% |
| Venezuelans | 99.1 /100 | #45 | Exceptional 6.2% |
| Immigrants | Lithuania | 99.0 /100 | #46 | Exceptional 6.2% |
| Latvians | 99.0 /100 | #47 | Exceptional 6.2% |
| Immigrants | Australia | 99.0 /100 | #48 | Exceptional 6.2% |
| German Russians | 99.0 /100 | #49 | Exceptional 6.2% |
| Soviet Union | 98.9 /100 | #50 | Exceptional 6.2% |
| Burmese | 98.9 /100 | #51 | Exceptional 6.2% |
| Immigrants | Turkey | 98.9 /100 | #52 | Exceptional 6.2% |
| Turks | 98.8 /100 | #53 | Exceptional 6.2% |
| Swedes | 98.8 /100 | #54 | Exceptional 6.2% |
| Immigrants | Netherlands | 98.7 /100 | #55 | Exceptional 6.2% |
| Immigrants | Burma/Myanmar | 98.7 /100 | #56 | Exceptional 6.2% |
| Immigrants | Saudi Arabia | 98.6 /100 | #57 | Exceptional 6.2% |
| Immigrants | Eastern Asia | 98.4 /100 | #58 | Exceptional 6.2% |