Immigrants from Kuwait vs Barbadian Unemployment Among Ages 30 to 34 years
COMPARE
Immigrants from Kuwait
Barbadian
Unemployment Among Ages 30 to 34 years
Unemployment Among Ages 30 to 34 years Comparison
Immigrants from Kuwait
Barbadians
5.0%
UNEMPLOYMENT AMONG AGES 30 TO 34 YEARS
99.5/ 100
METRIC RATING
26th/ 347
METRIC RANK
6.5%
UNEMPLOYMENT AMONG AGES 30 TO 34 YEARS
0.0/ 100
METRIC RATING
294th/ 347
METRIC RANK
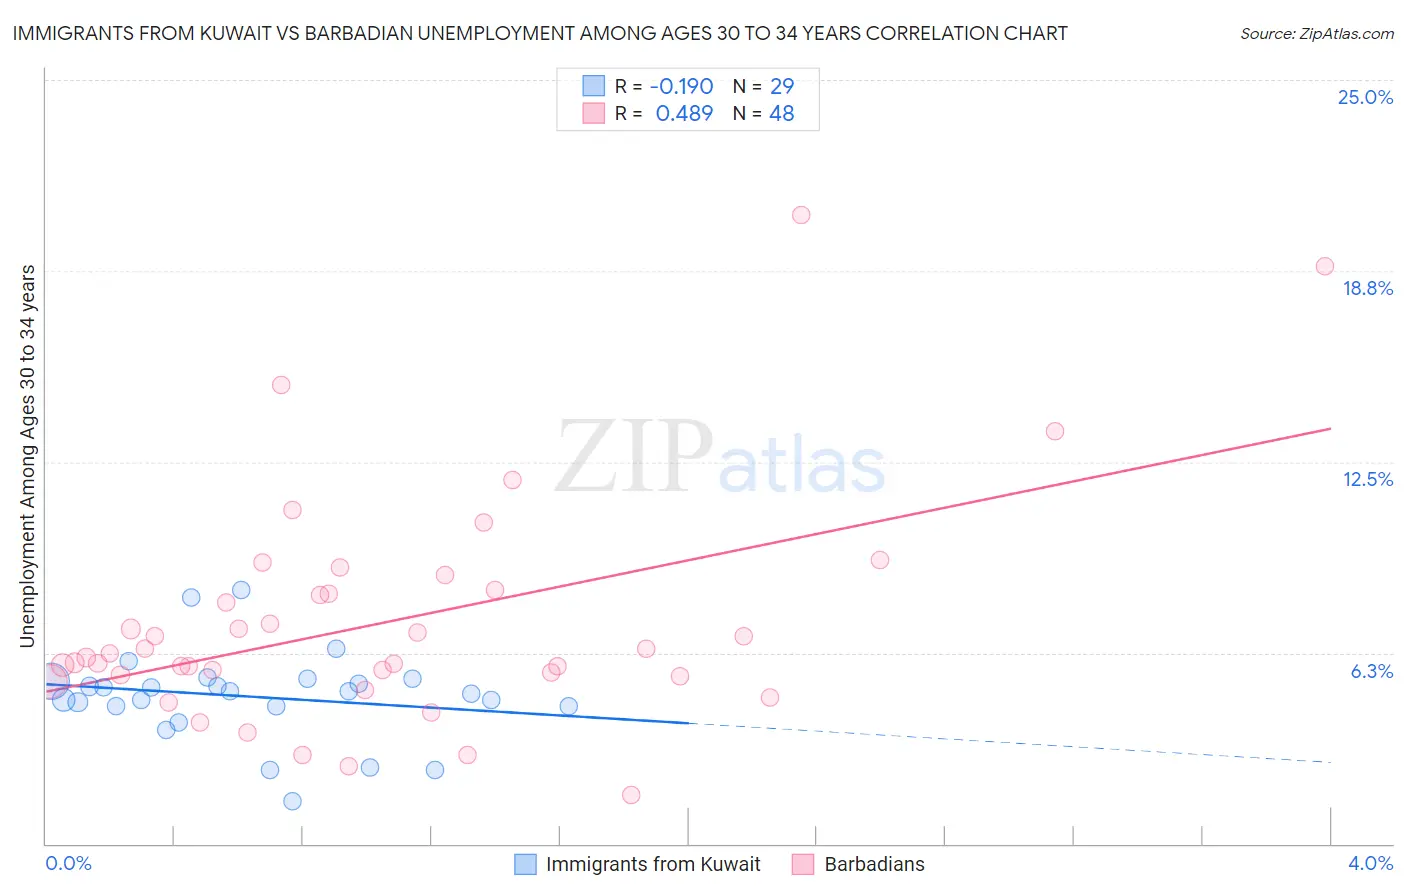
Immigrants from Kuwait vs Barbadian Unemployment Among Ages 30 to 34 years Correlation Chart
The statistical analysis conducted on geographies consisting of 134,713,450 people shows a poor negative correlation between the proportion of Immigrants from Kuwait and unemployment rate among population between the ages 30 and 34 in the United States with a correlation coefficient (R) of -0.190 and weighted average of 5.0%. Similarly, the statistical analysis conducted on geographies consisting of 139,164,017 people shows a moderate positive correlation between the proportion of Barbadians and unemployment rate among population between the ages 30 and 34 in the United States with a correlation coefficient (R) of 0.489 and weighted average of 6.5%, a difference of 31.6%.
Unemployment Among Ages 30 to 34 years Correlation Summary
| Measurement | Immigrants from Kuwait | Barbadian |
| Minimum | 1.4% | 1.6% |
| Maximum | 8.3% | 20.6% |
| Range | 6.9% | 19.0% |
| Mean | 4.8% | 7.2% |
| Median | 5.0% | 6.2% |
| Interquartile 25% (IQ1) | 4.5% | 5.5% |
| Interquartile 75% (IQ3) | 5.4% | 8.2% |
| Interquartile Range (IQR) | 0.86% | 2.7% |
| Standard Deviation (Sample) | 1.5% | 3.7% |
| Standard Deviation (Population) | 1.4% | 3.7% |
Similar Demographics by Unemployment Among Ages 30 to 34 years
Demographics Similar to Immigrants from Kuwait by Unemployment Among Ages 30 to 34 years
In terms of unemployment among ages 30 to 34 years, the demographic groups most similar to Immigrants from Kuwait are Danish (5.0%, a difference of 0.11%), Immigrants from Singapore (5.0%, a difference of 0.17%), Immigrants from Cuba (5.0%, a difference of 0.35%), German Russian (5.0%, a difference of 0.37%), and Norwegian (5.0%, a difference of 0.39%).
| Demographics | Rating | Rank | Unemployment Among Ages 30 to 34 years |
| Immigrants | Sudan | 99.8 /100 | #19 | Exceptional 4.9% |
| Immigrants | Taiwan | 99.8 /100 | #20 | Exceptional 4.9% |
| Ethiopians | 99.8 /100 | #21 | Exceptional 4.9% |
| Immigrants | South Central Asia | 99.8 /100 | #22 | Exceptional 4.9% |
| Hmong | 99.8 /100 | #23 | Exceptional 4.9% |
| Ugandans | 99.7 /100 | #24 | Exceptional 4.9% |
| Immigrants | Singapore | 99.5 /100 | #25 | Exceptional 5.0% |
| Immigrants | Kuwait | 99.5 /100 | #26 | Exceptional 5.0% |
| Danes | 99.5 /100 | #27 | Exceptional 5.0% |
| Immigrants | Cuba | 99.4 /100 | #28 | Exceptional 5.0% |
| German Russians | 99.4 /100 | #29 | Exceptional 5.0% |
| Norwegians | 99.4 /100 | #30 | Exceptional 5.0% |
| Somalis | 99.3 /100 | #31 | Exceptional 5.0% |
| Immigrants | Zaire | 99.3 /100 | #32 | Exceptional 5.0% |
| Immigrants | Saudi Arabia | 99.3 /100 | #33 | Exceptional 5.0% |
Demographics Similar to Barbadians by Unemployment Among Ages 30 to 34 years
In terms of unemployment among ages 30 to 34 years, the demographic groups most similar to Barbadians are Trinidadian and Tobagonian (6.5%, a difference of 0.24%), Immigrants from Jamaica (6.5%, a difference of 0.29%), Creek (6.6%, a difference of 0.39%), West Indian (6.5%, a difference of 0.43%), and Vietnamese (6.5%, a difference of 0.50%).
| Demographics | Rating | Rank | Unemployment Among Ages 30 to 34 years |
| Immigrants | West Indies | 0.0 /100 | #287 | Tragic 6.4% |
| Senegalese | 0.0 /100 | #288 | Tragic 6.4% |
| Menominee | 0.0 /100 | #289 | Tragic 6.4% |
| Immigrants | Trinidad and Tobago | 0.0 /100 | #290 | Tragic 6.5% |
| Jamaicans | 0.0 /100 | #291 | Tragic 6.5% |
| Vietnamese | 0.0 /100 | #292 | Tragic 6.5% |
| West Indians | 0.0 /100 | #293 | Tragic 6.5% |
| Barbadians | 0.0 /100 | #294 | Tragic 6.5% |
| Trinidadians and Tobagonians | 0.0 /100 | #295 | Tragic 6.5% |
| Immigrants | Jamaica | 0.0 /100 | #296 | Tragic 6.5% |
| Creek | 0.0 /100 | #297 | Tragic 6.6% |
| Immigrants | Barbados | 0.0 /100 | #298 | Tragic 6.6% |
| Dutch West Indians | 0.0 /100 | #299 | Tragic 6.6% |
| Bahamians | 0.0 /100 | #300 | Tragic 6.6% |
| Belizeans | 0.0 /100 | #301 | Tragic 6.6% |