Yuman vs Dutch West Indian Unemployment Among Ages 45 to 54 years
COMPARE
Yuman
Dutch West Indian
Unemployment Among Ages 45 to 54 years
Unemployment Among Ages 45 to 54 years Comparison
Yuman
Dutch West Indians
9.5%
UNEMPLOYMENT AMONG AGES 45 TO 54 YEARS
0.0/ 100
METRIC RATING
344th/ 347
METRIC RANK
5.0%
UNEMPLOYMENT AMONG AGES 45 TO 54 YEARS
0.0/ 100
METRIC RATING
278th/ 347
METRIC RANK
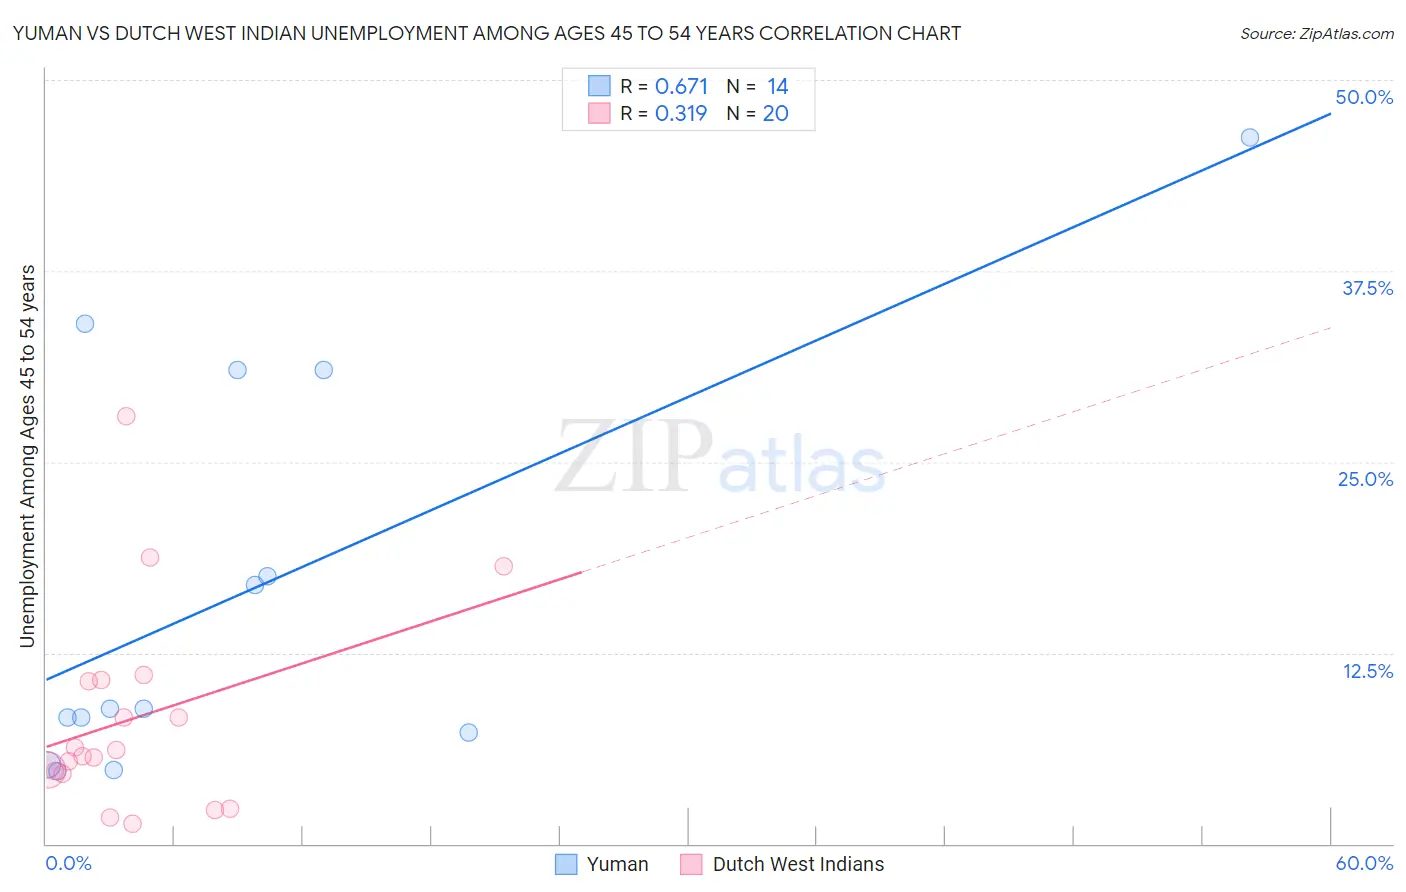
Yuman vs Dutch West Indian Unemployment Among Ages 45 to 54 years Correlation Chart
The statistical analysis conducted on geographies consisting of 40,470,848 people shows a significant positive correlation between the proportion of Yuman and unemployment rate among population between the ages 45 and 54 in the United States with a correlation coefficient (R) of 0.671 and weighted average of 9.5%. Similarly, the statistical analysis conducted on geographies consisting of 84,454,411 people shows a mild positive correlation between the proportion of Dutch West Indians and unemployment rate among population between the ages 45 and 54 in the United States with a correlation coefficient (R) of 0.319 and weighted average of 5.0%, a difference of 88.5%.
Unemployment Among Ages 45 to 54 years Correlation Summary
| Measurement | Yuman | Dutch West Indian |
| Minimum | 4.8% | 1.3% |
| Maximum | 46.2% | 28.0% |
| Range | 41.4% | 26.7% |
| Mean | 16.6% | 8.2% |
| Median | 8.8% | 5.9% |
| Interquartile 25% (IQ1) | 7.3% | 4.7% |
| Interquartile 75% (IQ3) | 31.0% | 10.7% |
| Interquartile Range (IQR) | 23.7% | 6.0% |
| Standard Deviation (Sample) | 13.4% | 6.7% |
| Standard Deviation (Population) | 13.0% | 6.5% |
Similar Demographics by Unemployment Among Ages 45 to 54 years
Demographics Similar to Yuman by Unemployment Among Ages 45 to 54 years
In terms of unemployment among ages 45 to 54 years, the demographic groups most similar to Yuman are Inupiat (9.2%, a difference of 3.3%), Cheyenne (10.6%, a difference of 11.3%), Alaskan Athabascan (8.5%, a difference of 12.2%), Paiute (7.8%, a difference of 22.0%), and Yup'ik (11.9%, a difference of 25.2%).
| Demographics | Rating | Rank | Unemployment Among Ages 45 to 54 years |
| Immigrants | Yemen | 0.0 /100 | #333 | Tragic 6.5% |
| Sioux | 0.0 /100 | #334 | Tragic 6.6% |
| Navajo | 0.0 /100 | #335 | Tragic 6.7% |
| Puerto Ricans | 0.0 /100 | #336 | Tragic 6.8% |
| Apache | 0.0 /100 | #337 | Tragic 7.0% |
| Colville | 0.0 /100 | #338 | Tragic 7.4% |
| Arapaho | 0.0 /100 | #339 | Tragic 7.5% |
| Hopi | 0.0 /100 | #340 | Tragic 7.5% |
| Paiute | 0.0 /100 | #341 | Tragic 7.8% |
| Alaskan Athabascans | 0.0 /100 | #342 | Tragic 8.5% |
| Inupiat | 0.0 /100 | #343 | Tragic 9.2% |
| Yuman | 0.0 /100 | #344 | Tragic 9.5% |
| Cheyenne | 0.0 /100 | #345 | Tragic 10.6% |
| Yup'ik | 0.0 /100 | #346 | Tragic 11.9% |
| Crow | 0.0 /100 | #347 | Tragic 13.7% |
Demographics Similar to Dutch West Indians by Unemployment Among Ages 45 to 54 years
In terms of unemployment among ages 45 to 54 years, the demographic groups most similar to Dutch West Indians are Nepalese (5.0%, a difference of 0.14%), Immigrants from Mexico (5.0%, a difference of 0.21%), French American Indian (5.0%, a difference of 0.33%), Blackfeet (5.1%, a difference of 0.35%), and Spanish American Indian (5.1%, a difference of 0.42%).
| Demographics | Rating | Rank | Unemployment Among Ages 45 to 54 years |
| Cajuns | 0.0 /100 | #271 | Tragic 5.0% |
| Immigrants | Central America | 0.0 /100 | #272 | Tragic 5.0% |
| Immigrants | Latin America | 0.0 /100 | #273 | Tragic 5.0% |
| U.S. Virgin Islanders | 0.0 /100 | #274 | Tragic 5.0% |
| Bermudans | 0.0 /100 | #275 | Tragic 5.0% |
| French American Indians | 0.0 /100 | #276 | Tragic 5.0% |
| Immigrants | Mexico | 0.0 /100 | #277 | Tragic 5.0% |
| Dutch West Indians | 0.0 /100 | #278 | Tragic 5.0% |
| Nepalese | 0.0 /100 | #279 | Tragic 5.0% |
| Blackfeet | 0.0 /100 | #280 | Tragic 5.1% |
| Spanish American Indians | 0.0 /100 | #281 | Tragic 5.1% |
| Africans | 0.0 /100 | #282 | Tragic 5.1% |
| Hispanics or Latinos | 0.0 /100 | #283 | Tragic 5.1% |
| Kiowa | 0.0 /100 | #284 | Tragic 5.1% |
| Iroquois | 0.0 /100 | #285 | Tragic 5.1% |