Immigrants from Cambodia vs Vietnamese Unemployment Among Ages 45 to 54 years
COMPARE
Immigrants from Cambodia
Vietnamese
Unemployment Among Ages 45 to 54 years
Unemployment Among Ages 45 to 54 years Comparison
Immigrants from Cambodia
Vietnamese
4.7%
UNEMPLOYMENT AMONG AGES 45 TO 54 YEARS
7.4/ 100
METRIC RATING
217th/ 347
METRIC RANK
5.4%
UNEMPLOYMENT AMONG AGES 45 TO 54 YEARS
0.0/ 100
METRIC RATING
307th/ 347
METRIC RANK
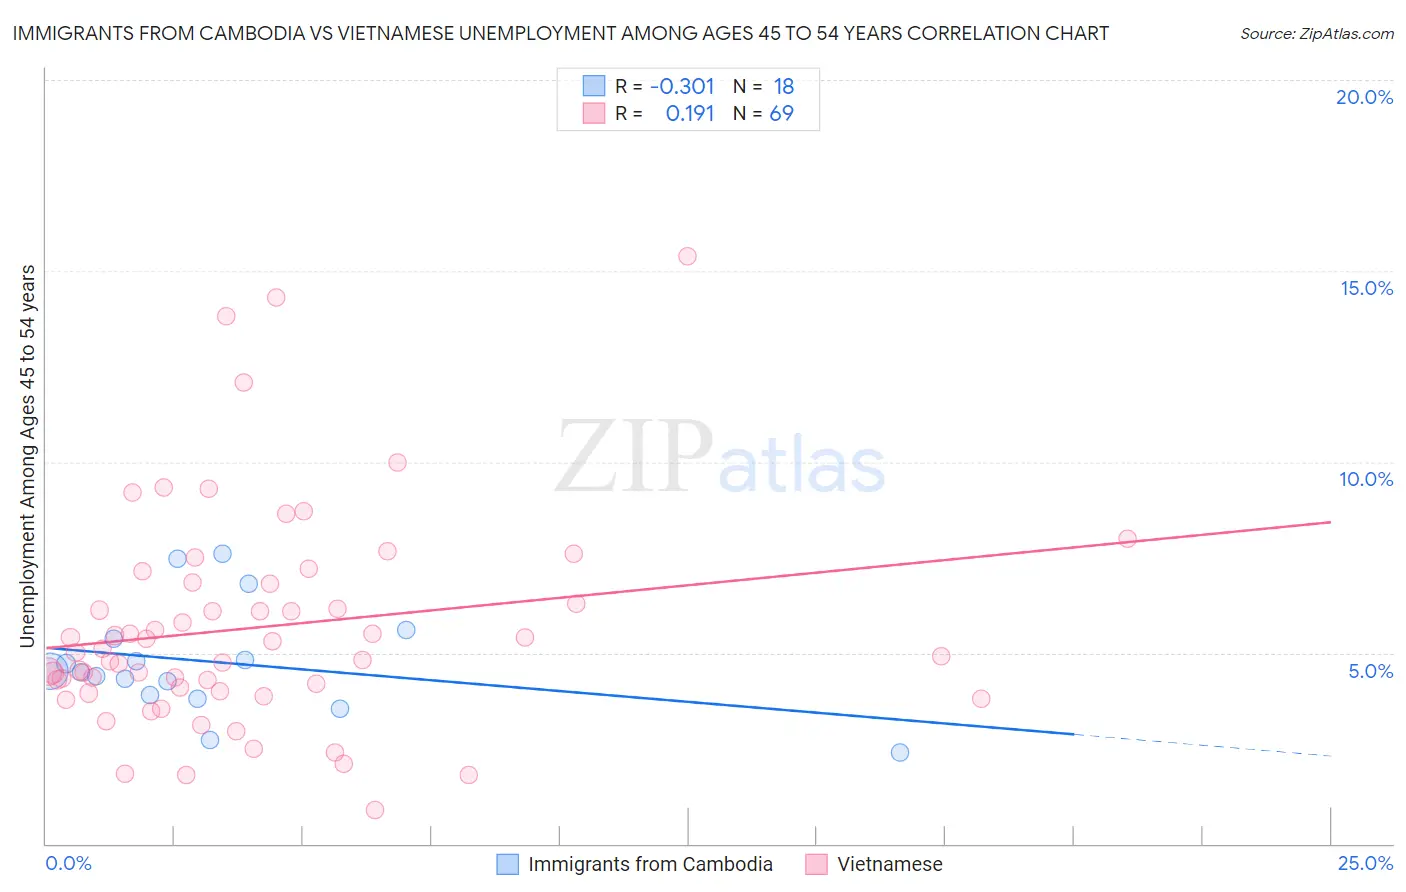
Immigrants from Cambodia vs Vietnamese Unemployment Among Ages 45 to 54 years Correlation Chart
The statistical analysis conducted on geographies consisting of 203,243,545 people shows a mild negative correlation between the proportion of Immigrants from Cambodia and unemployment rate among population between the ages 45 and 54 in the United States with a correlation coefficient (R) of -0.301 and weighted average of 4.7%. Similarly, the statistical analysis conducted on geographies consisting of 169,266,645 people shows a poor positive correlation between the proportion of Vietnamese and unemployment rate among population between the ages 45 and 54 in the United States with a correlation coefficient (R) of 0.191 and weighted average of 5.4%, a difference of 15.7%.
Unemployment Among Ages 45 to 54 years Correlation Summary
| Measurement | Immigrants from Cambodia | Vietnamese |
| Minimum | 2.4% | 0.90% |
| Maximum | 7.6% | 15.4% |
| Range | 5.2% | 14.5% |
| Mean | 4.8% | 5.7% |
| Median | 4.5% | 5.0% |
| Interquartile 25% (IQ1) | 3.9% | 4.1% |
| Interquartile 75% (IQ3) | 5.4% | 6.8% |
| Interquartile Range (IQR) | 1.5% | 2.8% |
| Standard Deviation (Sample) | 1.4% | 2.8% |
| Standard Deviation (Population) | 1.4% | 2.8% |
Similar Demographics by Unemployment Among Ages 45 to 54 years
Demographics Similar to Immigrants from Cambodia by Unemployment Among Ages 45 to 54 years
In terms of unemployment among ages 45 to 54 years, the demographic groups most similar to Immigrants from Cambodia are Immigrants from Uganda (4.7%, a difference of 0.050%), Nigerian (4.7%, a difference of 0.080%), Guamanian/Chamorro (4.7%, a difference of 0.10%), Choctaw (4.7%, a difference of 0.23%), and Immigrants from Southern Europe (4.7%, a difference of 0.26%).
| Demographics | Rating | Rank | Unemployment Among Ages 45 to 54 years |
| Immigrants | South America | 12.2 /100 | #210 | Poor 4.6% |
| Creek | 11.9 /100 | #211 | Poor 4.6% |
| Immigrants | Iran | 11.5 /100 | #212 | Poor 4.6% |
| Panamanians | 10.7 /100 | #213 | Poor 4.6% |
| Cherokee | 10.6 /100 | #214 | Poor 4.6% |
| Immigrants | Panama | 10.4 /100 | #215 | Poor 4.6% |
| Lumbee | 9.2 /100 | #216 | Tragic 4.6% |
| Immigrants | Cambodia | 7.4 /100 | #217 | Tragic 4.7% |
| Immigrants | Uganda | 7.1 /100 | #218 | Tragic 4.7% |
| Nigerians | 7.0 /100 | #219 | Tragic 4.7% |
| Guamanians/Chamorros | 6.8 /100 | #220 | Tragic 4.7% |
| Choctaw | 6.1 /100 | #221 | Tragic 4.7% |
| Immigrants | Southern Europe | 6.0 /100 | #222 | Tragic 4.7% |
| Potawatomi | 5.7 /100 | #223 | Tragic 4.7% |
| Comanche | 4.8 /100 | #224 | Tragic 4.7% |
Demographics Similar to Vietnamese by Unemployment Among Ages 45 to 54 years
In terms of unemployment among ages 45 to 54 years, the demographic groups most similar to Vietnamese are Immigrants from Bangladesh (5.4%, a difference of 0.26%), Immigrants from West Indies (5.4%, a difference of 0.42%), Immigrants from Jamaica (5.4%, a difference of 0.59%), Black/African American (5.4%, a difference of 0.76%), and Immigrants from Belize (5.3%, a difference of 0.77%).
| Demographics | Rating | Rank | Unemployment Among Ages 45 to 54 years |
| Central American Indians | 0.0 /100 | #300 | Tragic 5.3% |
| Menominee | 0.0 /100 | #301 | Tragic 5.3% |
| Immigrants | Ecuador | 0.0 /100 | #302 | Tragic 5.3% |
| Immigrants | Belize | 0.0 /100 | #303 | Tragic 5.3% |
| Immigrants | Jamaica | 0.0 /100 | #304 | Tragic 5.4% |
| Immigrants | West Indies | 0.0 /100 | #305 | Tragic 5.4% |
| Immigrants | Bangladesh | 0.0 /100 | #306 | Tragic 5.4% |
| Vietnamese | 0.0 /100 | #307 | Tragic 5.4% |
| Blacks/African Americans | 0.0 /100 | #308 | Tragic 5.4% |
| Barbadians | 0.0 /100 | #309 | Tragic 5.5% |
| Immigrants | Barbados | 0.0 /100 | #310 | Tragic 5.5% |
| Chippewa | 0.0 /100 | #311 | Tragic 5.5% |
| Immigrants | Grenada | 0.0 /100 | #312 | Tragic 5.6% |
| Shoshone | 0.0 /100 | #313 | Tragic 5.6% |
| Guyanese | 0.0 /100 | #314 | Tragic 5.6% |