Osage vs Immigrants from North America Unemployment Among Women with Children Ages 6 to 17 years
COMPARE
Osage
Immigrants from North America
Unemployment Among Women with Children Ages 6 to 17 years
Unemployment Among Women with Children Ages 6 to 17 years Comparison
Osage
Immigrants from North America
8.9%
UNEMPLOYMENT AMONG WOMEN WITH CHILDREN AGES 6 TO 17 YEARS
65.9/ 100
METRIC RATING
156th/ 347
METRIC RANK
9.2%
UNEMPLOYMENT AMONG WOMEN WITH CHILDREN AGES 6 TO 17 YEARS
12.7/ 100
METRIC RATING
206th/ 347
METRIC RANK
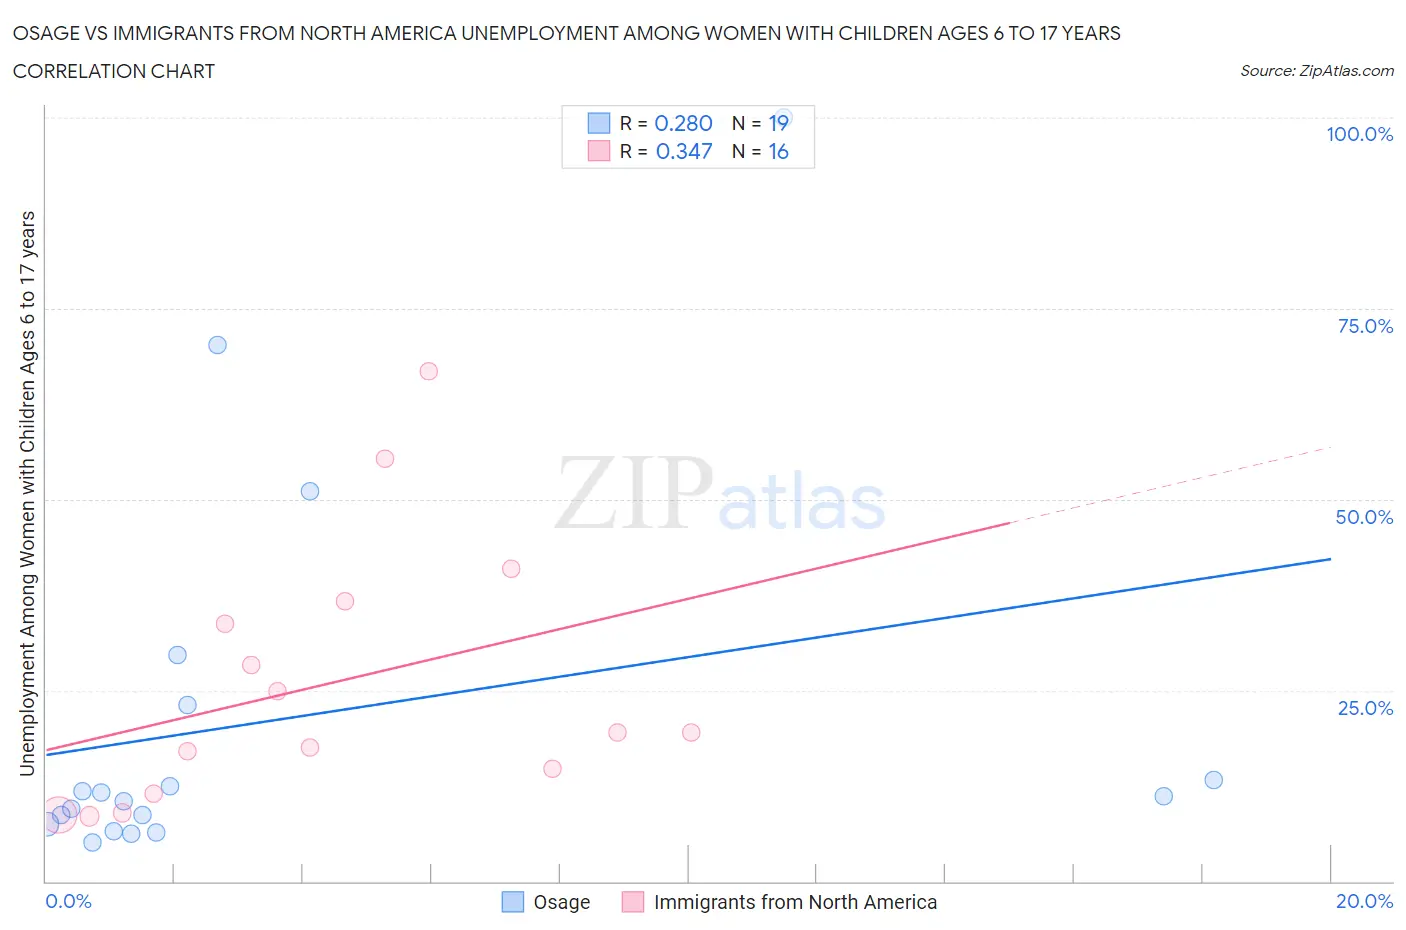
Osage vs Immigrants from North America Unemployment Among Women with Children Ages 6 to 17 years Correlation Chart
The statistical analysis conducted on geographies consisting of 80,640,206 people shows a weak positive correlation between the proportion of Osage and unemployment rate among women with children between the ages 6 and 17 in the United States with a correlation coefficient (R) of 0.280 and weighted average of 8.9%. Similarly, the statistical analysis conducted on geographies consisting of 313,856,079 people shows a mild positive correlation between the proportion of Immigrants from North America and unemployment rate among women with children between the ages 6 and 17 in the United States with a correlation coefficient (R) of 0.347 and weighted average of 9.2%, a difference of 2.9%.
Unemployment Among Women with Children Ages 6 to 17 years Correlation Summary
| Measurement | Osage | Immigrants from North America |
| Minimum | 5.1% | 8.5% |
| Maximum | 100.0% | 66.7% |
| Range | 94.9% | 58.2% |
| Mean | 21.2% | 25.8% |
| Median | 11.1% | 19.4% |
| Interquartile 25% (IQ1) | 7.5% | 13.1% |
| Interquartile 75% (IQ3) | 23.0% | 35.2% |
| Interquartile Range (IQR) | 15.5% | 22.2% |
| Standard Deviation (Sample) | 25.5% | 17.1% |
| Standard Deviation (Population) | 24.8% | 16.6% |
Similar Demographics by Unemployment Among Women with Children Ages 6 to 17 years
Demographics Similar to Osage by Unemployment Among Women with Children Ages 6 to 17 years
In terms of unemployment among women with children ages 6 to 17 years, the demographic groups most similar to Osage are Immigrants from Belgium (8.9%, a difference of 0.010%), Immigrants from Chile (8.9%, a difference of 0.030%), Spanish (8.9%, a difference of 0.10%), Immigrants from Hungary (8.9%, a difference of 0.12%), and Immigrants from Guyana (8.9%, a difference of 0.15%).
| Demographics | Rating | Rank | Unemployment Among Women with Children Ages 6 to 17 years |
| Croatians | 76.0 /100 | #149 | Good 8.8% |
| Greeks | 75.2 /100 | #150 | Good 8.9% |
| Immigrants | Eastern Africa | 74.6 /100 | #151 | Good 8.9% |
| Immigrants | Northern Europe | 74.6 /100 | #152 | Good 8.9% |
| Immigrants | Europe | 73.4 /100 | #153 | Good 8.9% |
| Vietnamese | 72.1 /100 | #154 | Good 8.9% |
| Immigrants | Greece | 71.8 /100 | #155 | Good 8.9% |
| Osage | 65.9 /100 | #156 | Good 8.9% |
| Immigrants | Belgium | 65.6 /100 | #157 | Good 8.9% |
| Immigrants | Chile | 65.3 /100 | #158 | Good 8.9% |
| Spanish | 63.8 /100 | #159 | Good 8.9% |
| Immigrants | Hungary | 63.4 /100 | #160 | Good 8.9% |
| Immigrants | Guyana | 63.0 /100 | #161 | Good 8.9% |
| Immigrants | Netherlands | 60.8 /100 | #162 | Good 8.9% |
| Mexican American Indians | 60.6 /100 | #163 | Good 8.9% |
Demographics Similar to Immigrants from North America by Unemployment Among Women with Children Ages 6 to 17 years
In terms of unemployment among women with children ages 6 to 17 years, the demographic groups most similar to Immigrants from North America are Immigrants from Western Europe (9.1%, a difference of 0.13%), Cuban (9.2%, a difference of 0.20%), Immigrants from Peru (9.2%, a difference of 0.20%), Salvadoran (9.2%, a difference of 0.21%), and Immigrants from Canada (9.1%, a difference of 0.23%).
| Demographics | Rating | Rank | Unemployment Among Women with Children Ages 6 to 17 years |
| Czechoslovakians | 20.8 /100 | #199 | Fair 9.1% |
| Trinidadians and Tobagonians | 18.2 /100 | #200 | Poor 9.1% |
| Immigrants | Trinidad and Tobago | 16.7 /100 | #201 | Poor 9.1% |
| Immigrants | Middle Africa | 15.6 /100 | #202 | Poor 9.1% |
| Maltese | 15.3 /100 | #203 | Poor 9.1% |
| Immigrants | Canada | 15.3 /100 | #204 | Poor 9.1% |
| Immigrants | Western Europe | 14.1 /100 | #205 | Poor 9.1% |
| Immigrants | North America | 12.7 /100 | #206 | Poor 9.2% |
| Cubans | 10.9 /100 | #207 | Poor 9.2% |
| Immigrants | Peru | 10.8 /100 | #208 | Poor 9.2% |
| Salvadorans | 10.7 /100 | #209 | Poor 9.2% |
| Finns | 10.0 /100 | #210 | Tragic 9.2% |
| Immigrants | Cuba | 9.6 /100 | #211 | Tragic 9.2% |
| Peruvians | 9.0 /100 | #212 | Tragic 9.2% |
| Spaniards | 8.2 /100 | #213 | Tragic 9.2% |