Yaqui vs Immigrants from Haiti Female Unemployment
COMPARE
Yaqui
Immigrants from Haiti
Female Unemployment
Female Unemployment Comparison
Yaqui
Immigrants from Haiti
6.0%
FEMALE UNEMPLOYMENT
0.0/ 100
METRIC RATING
278th/ 347
METRIC RANK
6.1%
FEMALE UNEMPLOYMENT
0.0/ 100
METRIC RATING
300th/ 347
METRIC RANK
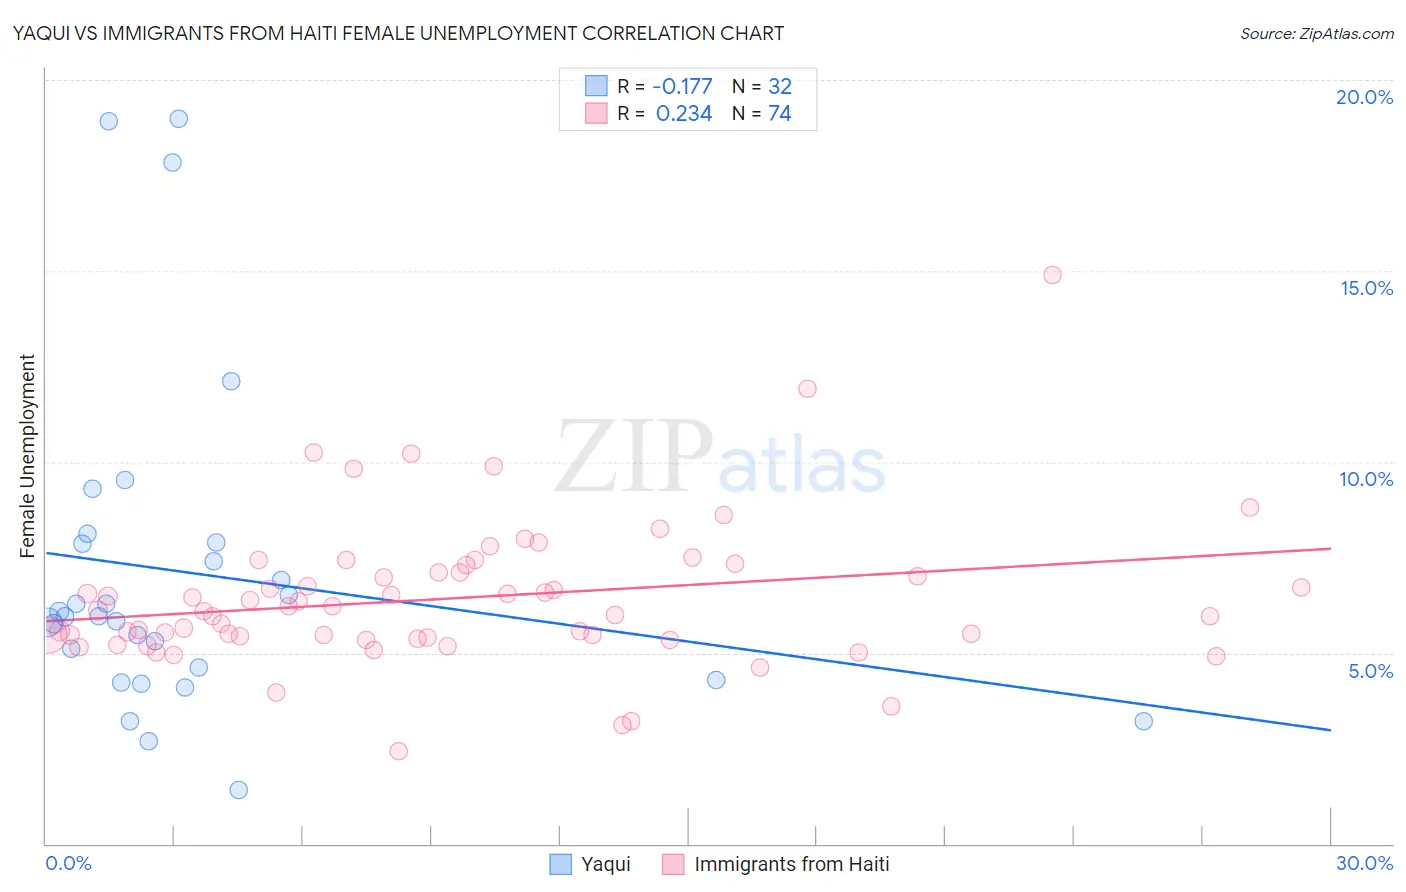
Yaqui vs Immigrants from Haiti Female Unemployment Correlation Chart
The statistical analysis conducted on geographies consisting of 107,534,058 people shows a poor negative correlation between the proportion of Yaqui and unemploymnet rate among females in the United States with a correlation coefficient (R) of -0.177 and weighted average of 6.0%. Similarly, the statistical analysis conducted on geographies consisting of 224,784,529 people shows a weak positive correlation between the proportion of Immigrants from Haiti and unemploymnet rate among females in the United States with a correlation coefficient (R) of 0.234 and weighted average of 6.1%, a difference of 2.1%.
Female Unemployment Correlation Summary
| Measurement | Yaqui | Immigrants from Haiti |
| Minimum | 1.4% | 2.4% |
| Maximum | 19.0% | 14.9% |
| Range | 17.6% | 12.5% |
| Mean | 7.1% | 6.4% |
| Median | 5.9% | 6.1% |
| Interquartile 25% (IQ1) | 4.5% | 5.4% |
| Interquartile 75% (IQ3) | 7.9% | 7.1% |
| Interquartile Range (IQR) | 3.4% | 1.7% |
| Standard Deviation (Sample) | 4.3% | 1.9% |
| Standard Deviation (Population) | 4.2% | 1.9% |
Similar Demographics by Female Unemployment
Demographics Similar to Yaqui by Female Unemployment
In terms of female unemployment, the demographic groups most similar to Yaqui are Immigrants from Ghana (6.0%, a difference of 0.0%), Armenian (6.0%, a difference of 0.11%), Mexican American Indian (6.0%, a difference of 0.17%), Guatemalan (6.0%, a difference of 0.21%), and Bahamian (6.0%, a difference of 0.40%).
| Demographics | Rating | Rank | Female Unemployment |
| Central Americans | 0.0 /100 | #271 | Tragic 5.9% |
| Lumbee | 0.0 /100 | #272 | Tragic 5.9% |
| Ghanaians | 0.0 /100 | #273 | Tragic 5.9% |
| Africans | 0.0 /100 | #274 | Tragic 5.9% |
| Senegalese | 0.0 /100 | #275 | Tragic 6.0% |
| Bahamians | 0.0 /100 | #276 | Tragic 6.0% |
| Immigrants | Ghana | 0.0 /100 | #277 | Tragic 6.0% |
| Yaqui | 0.0 /100 | #278 | Tragic 6.0% |
| Armenians | 0.0 /100 | #279 | Tragic 6.0% |
| Mexican American Indians | 0.0 /100 | #280 | Tragic 6.0% |
| Guatemalans | 0.0 /100 | #281 | Tragic 6.0% |
| Colville | 0.0 /100 | #282 | Tragic 6.0% |
| Salvadorans | 0.0 /100 | #283 | Tragic 6.0% |
| Immigrants | Senegal | 0.0 /100 | #284 | Tragic 6.1% |
| Immigrants | Cabo Verde | 0.0 /100 | #285 | Tragic 6.1% |
Demographics Similar to Immigrants from Haiti by Female Unemployment
In terms of female unemployment, the demographic groups most similar to Immigrants from Haiti are Ute (6.1%, a difference of 0.040%), Jamaican (6.1%, a difference of 0.15%), West Indian (6.1%, a difference of 0.17%), Alaskan Athabascan (6.1%, a difference of 0.18%), and Immigrants from Latin America (6.1%, a difference of 0.20%).
| Demographics | Rating | Rank | Female Unemployment |
| Mexicans | 0.0 /100 | #293 | Tragic 6.1% |
| Immigrants | El Salvador | 0.0 /100 | #294 | Tragic 6.1% |
| Immigrants | Latin America | 0.0 /100 | #295 | Tragic 6.1% |
| Alaskan Athabascans | 0.0 /100 | #296 | Tragic 6.1% |
| West Indians | 0.0 /100 | #297 | Tragic 6.1% |
| Jamaicans | 0.0 /100 | #298 | Tragic 6.1% |
| Ute | 0.0 /100 | #299 | Tragic 6.1% |
| Immigrants | Haiti | 0.0 /100 | #300 | Tragic 6.1% |
| Immigrants | Barbados | 0.0 /100 | #301 | Tragic 6.2% |
| U.S. Virgin Islanders | 0.0 /100 | #302 | Tragic 6.2% |
| Barbadians | 0.0 /100 | #303 | Tragic 6.2% |
| Immigrants | Jamaica | 0.0 /100 | #304 | Tragic 6.2% |
| Spanish American Indians | 0.0 /100 | #305 | Tragic 6.2% |
| Immigrants | Central America | 0.0 /100 | #306 | Tragic 6.2% |
| Shoshone | 0.0 /100 | #307 | Tragic 6.2% |