Immigrants from Poland vs Immigrants from Haiti Female Unemployment
COMPARE
Immigrants from Poland
Immigrants from Haiti
Female Unemployment
Female Unemployment Comparison
Immigrants from Poland
Immigrants from Haiti
5.3%
FEMALE UNEMPLOYMENT
50.0/ 100
METRIC RATING
174th/ 347
METRIC RANK
6.1%
FEMALE UNEMPLOYMENT
0.0/ 100
METRIC RATING
300th/ 347
METRIC RANK
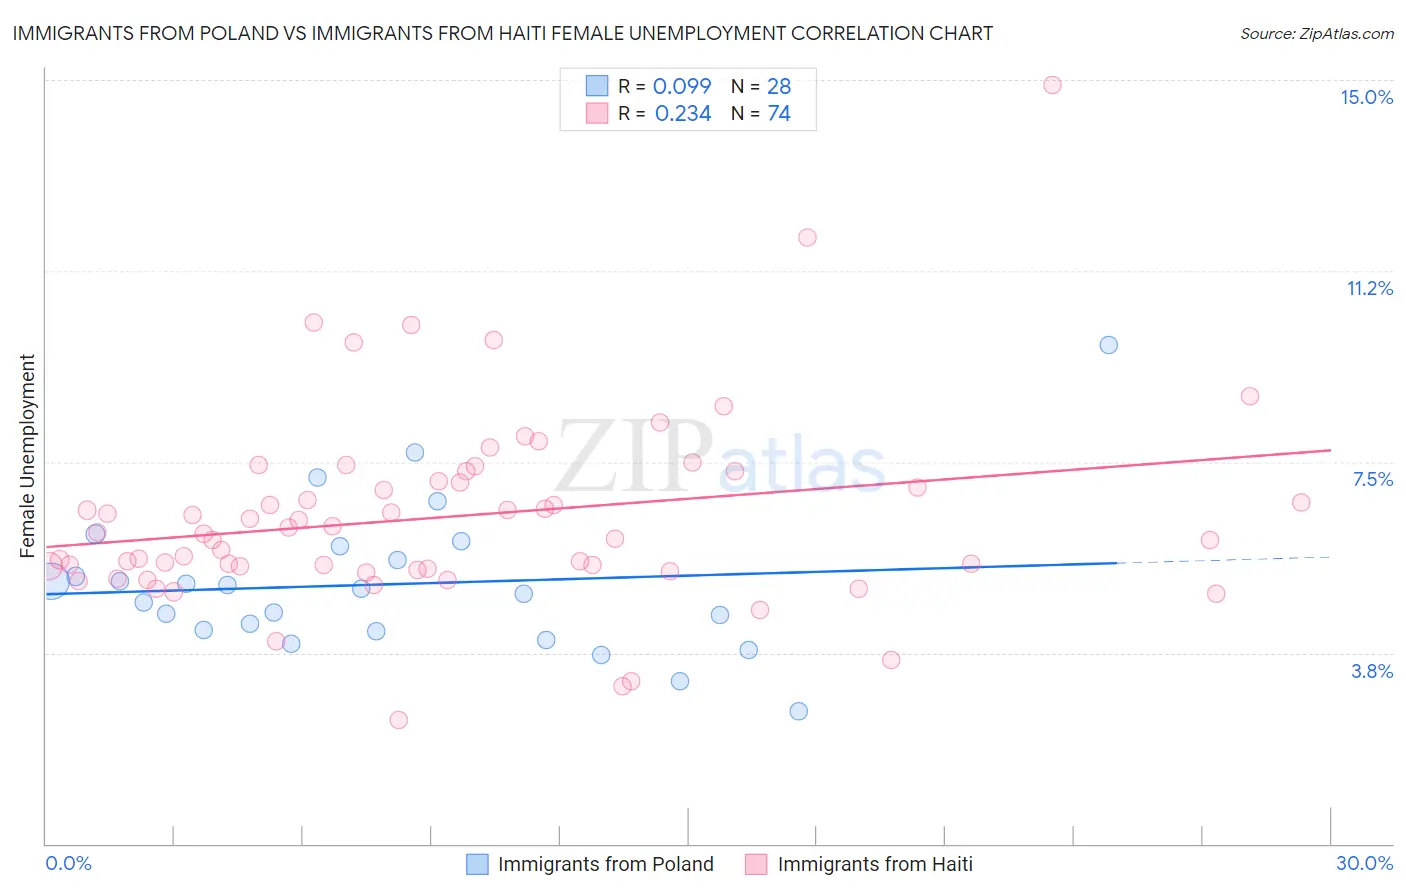
Immigrants from Poland vs Immigrants from Haiti Female Unemployment Correlation Chart
The statistical analysis conducted on geographies consisting of 303,909,658 people shows a slight positive correlation between the proportion of Immigrants from Poland and unemploymnet rate among females in the United States with a correlation coefficient (R) of 0.099 and weighted average of 5.3%. Similarly, the statistical analysis conducted on geographies consisting of 224,784,529 people shows a weak positive correlation between the proportion of Immigrants from Haiti and unemploymnet rate among females in the United States with a correlation coefficient (R) of 0.234 and weighted average of 6.1%, a difference of 16.6%.
Female Unemployment Correlation Summary
| Measurement | Immigrants from Poland | Immigrants from Haiti |
| Minimum | 2.6% | 2.4% |
| Maximum | 9.8% | 14.9% |
| Range | 7.2% | 12.5% |
| Mean | 5.1% | 6.4% |
| Median | 5.0% | 6.1% |
| Interquartile 25% (IQ1) | 4.2% | 5.4% |
| Interquartile 75% (IQ3) | 5.7% | 7.1% |
| Interquartile Range (IQR) | 1.5% | 1.7% |
| Standard Deviation (Sample) | 1.5% | 1.9% |
| Standard Deviation (Population) | 1.4% | 1.9% |
Similar Demographics by Female Unemployment
Demographics Similar to Immigrants from Poland by Female Unemployment
In terms of female unemployment, the demographic groups most similar to Immigrants from Poland are Iranian (5.3%, a difference of 0.020%), Immigrants from Uganda (5.3%, a difference of 0.040%), Immigrants from Laos (5.3%, a difference of 0.15%), Immigrants from Vietnam (5.3%, a difference of 0.15%), and Immigrants from Morocco (5.3%, a difference of 0.16%).
| Demographics | Rating | Rank | Female Unemployment |
| Immigrants | Thailand | 62.1 /100 | #167 | Good 5.2% |
| Sri Lankans | 59.4 /100 | #168 | Average 5.2% |
| Immigrants | Chile | 59.0 /100 | #169 | Average 5.2% |
| Spanish | 55.9 /100 | #170 | Average 5.2% |
| Immigrants | Denmark | 55.0 /100 | #171 | Average 5.2% |
| Immigrants | Uganda | 50.7 /100 | #172 | Average 5.3% |
| Iranians | 50.4 /100 | #173 | Average 5.3% |
| Immigrants | Poland | 50.0 /100 | #174 | Average 5.3% |
| Immigrants | Laos | 47.5 /100 | #175 | Average 5.3% |
| Immigrants | Vietnam | 47.5 /100 | #176 | Average 5.3% |
| Immigrants | Morocco | 47.4 /100 | #177 | Average 5.3% |
| Immigrants | Southern Europe | 46.2 /100 | #178 | Average 5.3% |
| Laotians | 45.1 /100 | #179 | Average 5.3% |
| Immigrants | Congo | 43.1 /100 | #180 | Average 5.3% |
| Taiwanese | 42.7 /100 | #181 | Average 5.3% |
Demographics Similar to Immigrants from Haiti by Female Unemployment
In terms of female unemployment, the demographic groups most similar to Immigrants from Haiti are Ute (6.1%, a difference of 0.040%), Jamaican (6.1%, a difference of 0.15%), West Indian (6.1%, a difference of 0.17%), Alaskan Athabascan (6.1%, a difference of 0.18%), and Immigrants from Latin America (6.1%, a difference of 0.20%).
| Demographics | Rating | Rank | Female Unemployment |
| Mexicans | 0.0 /100 | #293 | Tragic 6.1% |
| Immigrants | El Salvador | 0.0 /100 | #294 | Tragic 6.1% |
| Immigrants | Latin America | 0.0 /100 | #295 | Tragic 6.1% |
| Alaskan Athabascans | 0.0 /100 | #296 | Tragic 6.1% |
| West Indians | 0.0 /100 | #297 | Tragic 6.1% |
| Jamaicans | 0.0 /100 | #298 | Tragic 6.1% |
| Ute | 0.0 /100 | #299 | Tragic 6.1% |
| Immigrants | Haiti | 0.0 /100 | #300 | Tragic 6.1% |
| Immigrants | Barbados | 0.0 /100 | #301 | Tragic 6.2% |
| U.S. Virgin Islanders | 0.0 /100 | #302 | Tragic 6.2% |
| Barbadians | 0.0 /100 | #303 | Tragic 6.2% |
| Immigrants | Jamaica | 0.0 /100 | #304 | Tragic 6.2% |
| Spanish American Indians | 0.0 /100 | #305 | Tragic 6.2% |
| Immigrants | Central America | 0.0 /100 | #306 | Tragic 6.2% |
| Shoshone | 0.0 /100 | #307 | Tragic 6.2% |