Yaqui vs Immigrants from Syria Female Unemployment
COMPARE
Yaqui
Immigrants from Syria
Female Unemployment
Female Unemployment Comparison
Yaqui
Immigrants from Syria
6.0%
FEMALE UNEMPLOYMENT
0.0/ 100
METRIC RATING
278th/ 347
METRIC RANK
5.6%
FEMALE UNEMPLOYMENT
0.8/ 100
METRIC RATING
250th/ 347
METRIC RANK
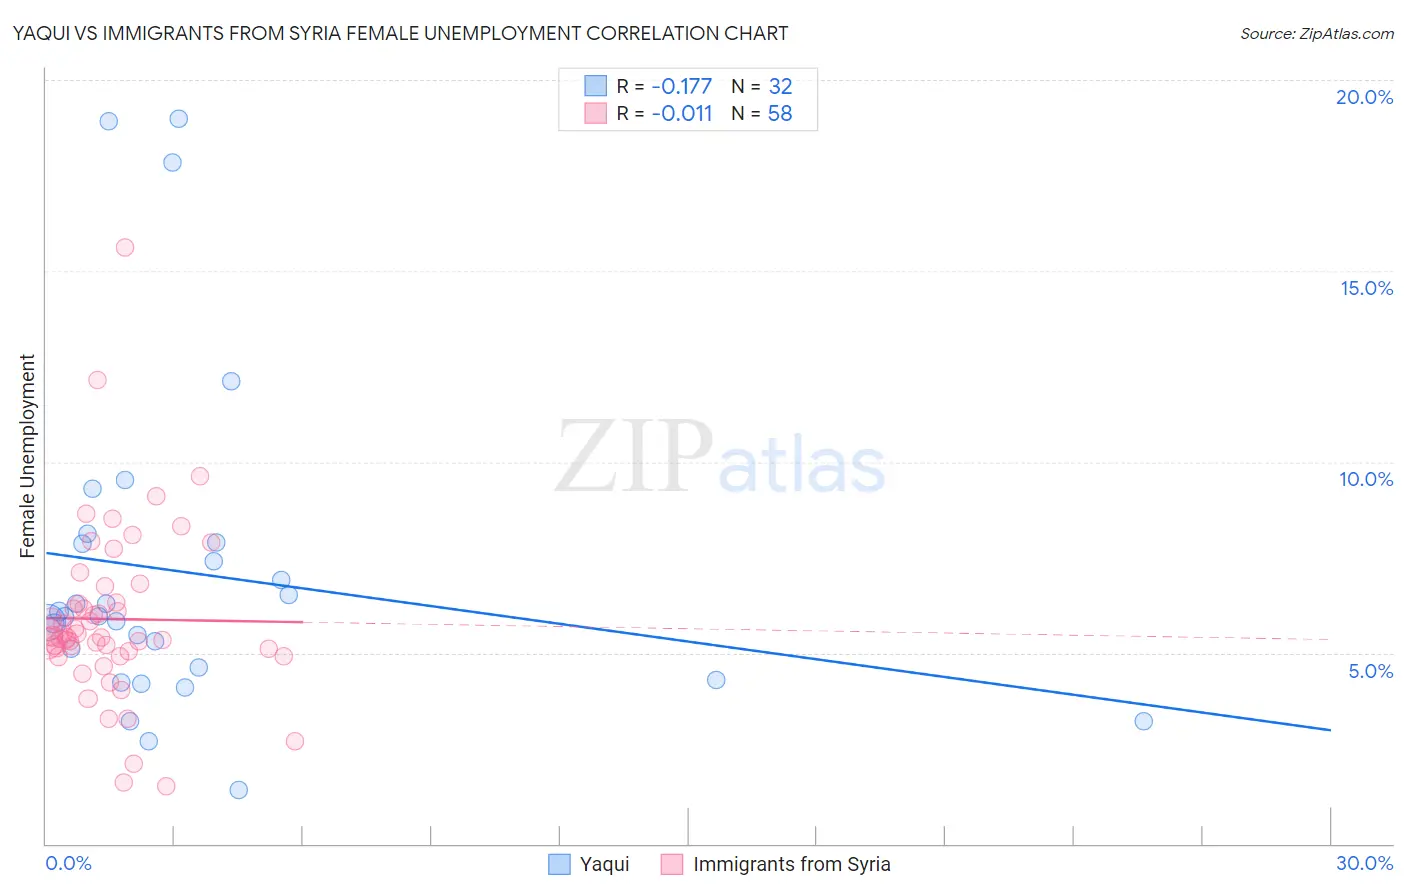
Yaqui vs Immigrants from Syria Female Unemployment Correlation Chart
The statistical analysis conducted on geographies consisting of 107,534,058 people shows a poor negative correlation between the proportion of Yaqui and unemploymnet rate among females in the United States with a correlation coefficient (R) of -0.177 and weighted average of 6.0%. Similarly, the statistical analysis conducted on geographies consisting of 173,953,717 people shows no correlation between the proportion of Immigrants from Syria and unemploymnet rate among females in the United States with a correlation coefficient (R) of -0.011 and weighted average of 5.6%, a difference of 6.5%.
Female Unemployment Correlation Summary
| Measurement | Yaqui | Immigrants from Syria |
| Minimum | 1.4% | 1.5% |
| Maximum | 19.0% | 15.6% |
| Range | 17.6% | 14.1% |
| Mean | 7.1% | 5.9% |
| Median | 5.9% | 5.4% |
| Interquartile 25% (IQ1) | 4.5% | 5.0% |
| Interquartile 75% (IQ3) | 7.9% | 6.3% |
| Interquartile Range (IQR) | 3.4% | 1.3% |
| Standard Deviation (Sample) | 4.3% | 2.3% |
| Standard Deviation (Population) | 4.2% | 2.3% |
Similar Demographics by Female Unemployment
Demographics Similar to Yaqui by Female Unemployment
In terms of female unemployment, the demographic groups most similar to Yaqui are Immigrants from Ghana (6.0%, a difference of 0.0%), Armenian (6.0%, a difference of 0.11%), Mexican American Indian (6.0%, a difference of 0.17%), Guatemalan (6.0%, a difference of 0.21%), and Bahamian (6.0%, a difference of 0.40%).
| Demographics | Rating | Rank | Female Unemployment |
| Central Americans | 0.0 /100 | #271 | Tragic 5.9% |
| Lumbee | 0.0 /100 | #272 | Tragic 5.9% |
| Ghanaians | 0.0 /100 | #273 | Tragic 5.9% |
| Africans | 0.0 /100 | #274 | Tragic 5.9% |
| Senegalese | 0.0 /100 | #275 | Tragic 6.0% |
| Bahamians | 0.0 /100 | #276 | Tragic 6.0% |
| Immigrants | Ghana | 0.0 /100 | #277 | Tragic 6.0% |
| Yaqui | 0.0 /100 | #278 | Tragic 6.0% |
| Armenians | 0.0 /100 | #279 | Tragic 6.0% |
| Mexican American Indians | 0.0 /100 | #280 | Tragic 6.0% |
| Guatemalans | 0.0 /100 | #281 | Tragic 6.0% |
| Colville | 0.0 /100 | #282 | Tragic 6.0% |
| Salvadorans | 0.0 /100 | #283 | Tragic 6.0% |
| Immigrants | Senegal | 0.0 /100 | #284 | Tragic 6.1% |
| Immigrants | Cabo Verde | 0.0 /100 | #285 | Tragic 6.1% |
Demographics Similar to Immigrants from Syria by Female Unemployment
In terms of female unemployment, the demographic groups most similar to Immigrants from Syria are Assyrian/Chaldean/Syriac (5.6%, a difference of 0.060%), Cajun (5.7%, a difference of 0.26%), Immigrants from Uzbekistan (5.6%, a difference of 0.29%), Cree (5.6%, a difference of 0.33%), and Immigrants from Sierra Leone (5.7%, a difference of 0.41%).
| Demographics | Rating | Rank | Female Unemployment |
| Spanish Americans | 2.2 /100 | #243 | Tragic 5.6% |
| Immigrants | Liberia | 1.5 /100 | #244 | Tragic 5.6% |
| Guamanians/Chamorros | 1.4 /100 | #245 | Tragic 5.6% |
| Japanese | 1.2 /100 | #246 | Tragic 5.6% |
| Immigrants | Western Asia | 1.1 /100 | #247 | Tragic 5.6% |
| Cree | 1.0 /100 | #248 | Tragic 5.6% |
| Immigrants | Uzbekistan | 1.0 /100 | #249 | Tragic 5.6% |
| Immigrants | Syria | 0.8 /100 | #250 | Tragic 5.6% |
| Assyrians/Chaldeans/Syriacs | 0.8 /100 | #251 | Tragic 5.6% |
| Cajuns | 0.7 /100 | #252 | Tragic 5.7% |
| Immigrants | Sierra Leone | 0.6 /100 | #253 | Tragic 5.7% |
| Immigrants | Immigrants | 0.6 /100 | #254 | Tragic 5.7% |
| Immigrants | Cameroon | 0.6 /100 | #255 | Tragic 5.7% |
| Sub-Saharan Africans | 0.4 /100 | #256 | Tragic 5.7% |
| Dutch West Indians | 0.3 /100 | #257 | Tragic 5.7% |