Immigrants from Bangladesh vs Immigrants from Haiti Female Unemployment
COMPARE
Immigrants from Bangladesh
Immigrants from Haiti
Female Unemployment
Female Unemployment Comparison
Immigrants from Bangladesh
Immigrants from Haiti
6.5%
FEMALE UNEMPLOYMENT
0.0/ 100
METRIC RATING
319th/ 347
METRIC RANK
6.1%
FEMALE UNEMPLOYMENT
0.0/ 100
METRIC RATING
300th/ 347
METRIC RANK
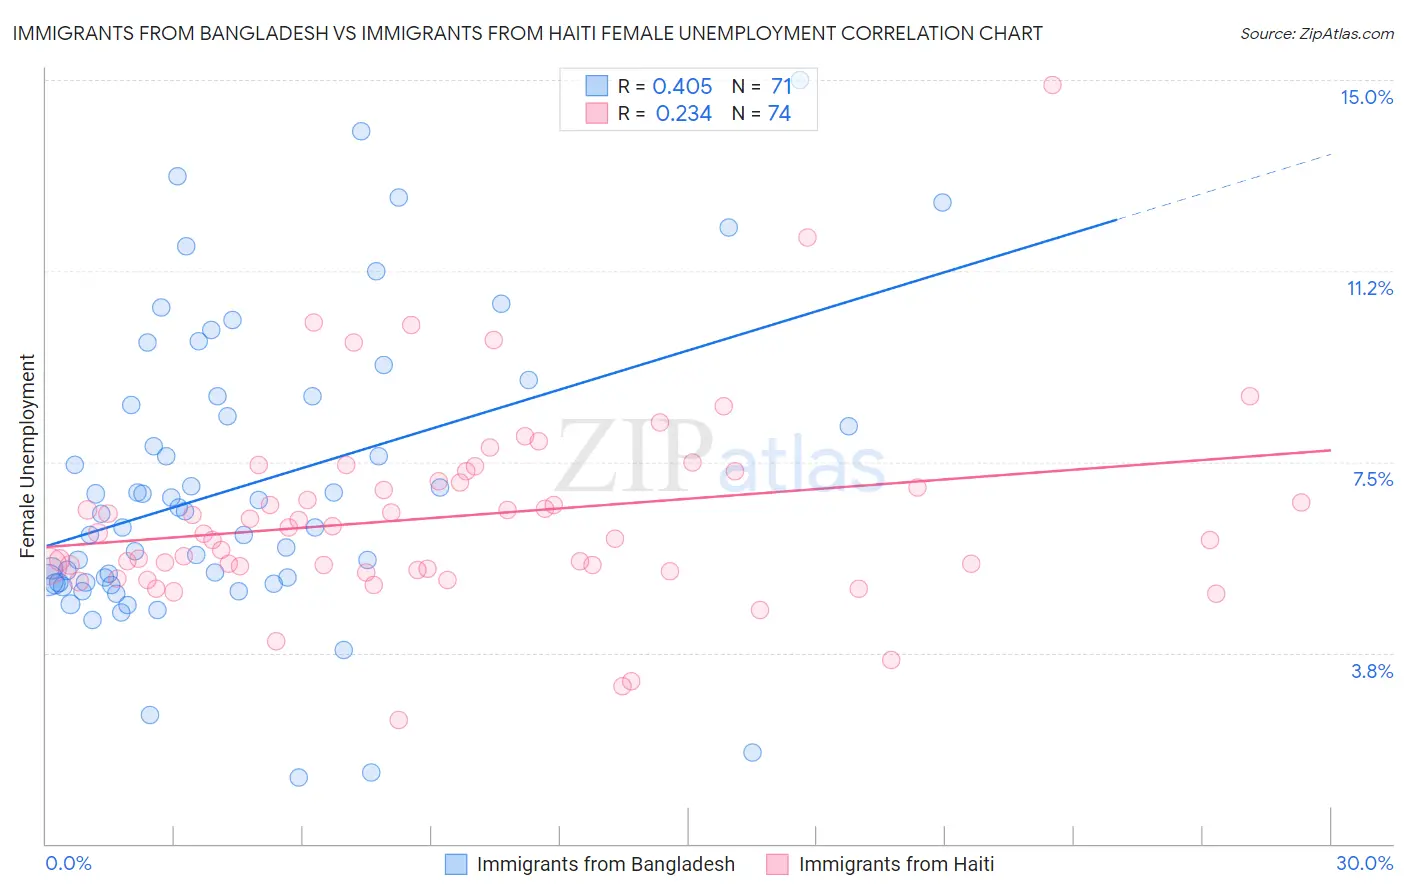
Immigrants from Bangladesh vs Immigrants from Haiti Female Unemployment Correlation Chart
The statistical analysis conducted on geographies consisting of 203,458,285 people shows a moderate positive correlation between the proportion of Immigrants from Bangladesh and unemploymnet rate among females in the United States with a correlation coefficient (R) of 0.405 and weighted average of 6.5%. Similarly, the statistical analysis conducted on geographies consisting of 224,784,529 people shows a weak positive correlation between the proportion of Immigrants from Haiti and unemploymnet rate among females in the United States with a correlation coefficient (R) of 0.234 and weighted average of 6.1%, a difference of 5.3%.
Female Unemployment Correlation Summary
| Measurement | Immigrants from Bangladesh | Immigrants from Haiti |
| Minimum | 1.3% | 2.4% |
| Maximum | 15.0% | 14.9% |
| Range | 13.7% | 12.5% |
| Mean | 7.0% | 6.4% |
| Median | 6.5% | 6.1% |
| Interquartile 25% (IQ1) | 5.1% | 5.4% |
| Interquartile 75% (IQ3) | 8.8% | 7.1% |
| Interquartile Range (IQR) | 3.7% | 1.7% |
| Standard Deviation (Sample) | 2.9% | 1.9% |
| Standard Deviation (Population) | 2.9% | 1.9% |
Demographics Similar to Immigrants from Bangladesh and Immigrants from Haiti by Female Unemployment
In terms of female unemployment, the demographic groups most similar to Immigrants from Bangladesh are British West Indian (6.4%, a difference of 0.19%), Immigrants from St. Vincent and the Grenadines (6.4%, a difference of 0.47%), Houma (6.4%, a difference of 0.93%), Pueblo (6.4%, a difference of 1.2%), and Immigrants from Ecuador (6.4%, a difference of 1.5%). Similarly, the demographic groups most similar to Immigrants from Haiti are Ute (6.1%, a difference of 0.040%), Immigrants from Barbados (6.2%, a difference of 0.45%), U.S. Virgin Islander (6.2%, a difference of 0.60%), Barbadian (6.2%, a difference of 0.95%), and Immigrants from Jamaica (6.2%, a difference of 1.3%).
| Demographics | Rating | Rank | Female Unemployment |
| Ute | 0.0 /100 | #299 | Tragic 6.1% |
| Immigrants | Haiti | 0.0 /100 | #300 | Tragic 6.1% |
| Immigrants | Barbados | 0.0 /100 | #301 | Tragic 6.2% |
| U.S. Virgin Islanders | 0.0 /100 | #302 | Tragic 6.2% |
| Barbadians | 0.0 /100 | #303 | Tragic 6.2% |
| Immigrants | Jamaica | 0.0 /100 | #304 | Tragic 6.2% |
| Spanish American Indians | 0.0 /100 | #305 | Tragic 6.2% |
| Immigrants | Central America | 0.0 /100 | #306 | Tragic 6.2% |
| Shoshone | 0.0 /100 | #307 | Tragic 6.2% |
| Hispanics or Latinos | 0.0 /100 | #308 | Tragic 6.2% |
| Ecuadorians | 0.0 /100 | #309 | Tragic 6.3% |
| Central American Indians | 0.0 /100 | #310 | Tragic 6.3% |
| Immigrants | Mexico | 0.0 /100 | #311 | Tragic 6.3% |
| Immigrants | Grenada | 0.0 /100 | #312 | Tragic 6.3% |
| Belizeans | 0.0 /100 | #313 | Tragic 6.3% |
| Immigrants | Ecuador | 0.0 /100 | #314 | Tragic 6.4% |
| Pueblo | 0.0 /100 | #315 | Tragic 6.4% |
| Houma | 0.0 /100 | #316 | Tragic 6.4% |
| Immigrants | St. Vincent and the Grenadines | 0.0 /100 | #317 | Tragic 6.4% |
| British West Indians | 0.0 /100 | #318 | Tragic 6.4% |
| Immigrants | Bangladesh | 0.0 /100 | #319 | Tragic 6.5% |