Immigrants from Dominica vs Immigrants from Eastern Asia Unemployment Among Ages 20 to 24 years
COMPARE
Immigrants from Dominica
Immigrants from Eastern Asia
Unemployment Among Ages 20 to 24 years
Unemployment Among Ages 20 to 24 years Comparison
Immigrants from Dominica
Immigrants from Eastern Asia
12.8%
UNEMPLOYMENT AMONG AGES 20 TO 24 YEARS
0.0/ 100
METRIC RATING
316th/ 347
METRIC RANK
10.3%
UNEMPLOYMENT AMONG AGES 20 TO 24 YEARS
52.7/ 100
METRIC RATING
171st/ 347
METRIC RANK
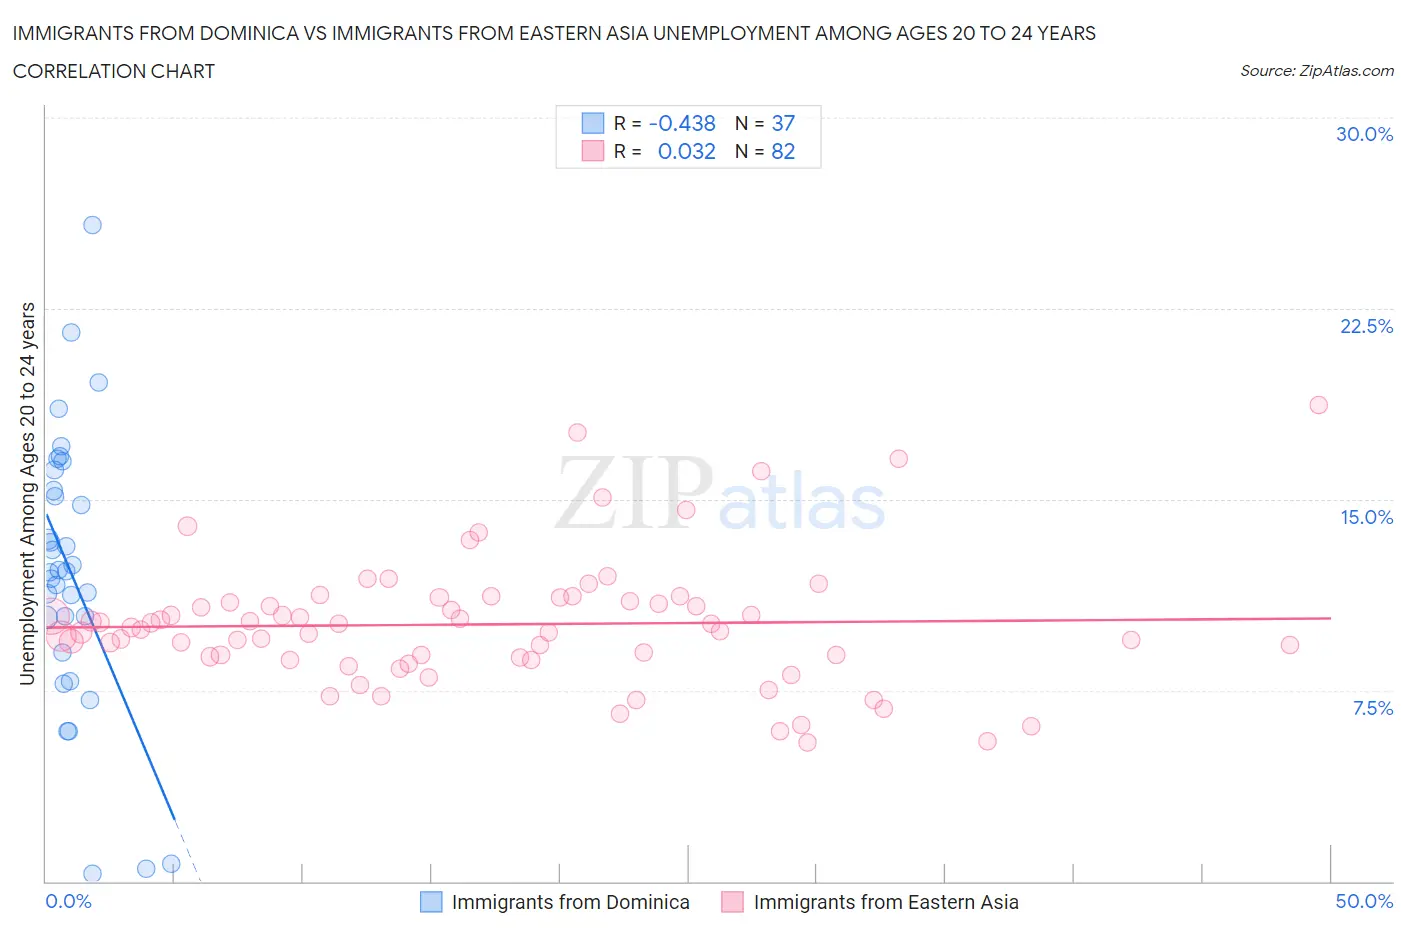
Immigrants from Dominica vs Immigrants from Eastern Asia Unemployment Among Ages 20 to 24 years Correlation Chart
The statistical analysis conducted on geographies consisting of 83,329,591 people shows a moderate negative correlation between the proportion of Immigrants from Dominica and unemployment rate among population between the ages 20 and 24 in the United States with a correlation coefficient (R) of -0.438 and weighted average of 12.8%. Similarly, the statistical analysis conducted on geographies consisting of 475,626,632 people shows no correlation between the proportion of Immigrants from Eastern Asia and unemployment rate among population between the ages 20 and 24 in the United States with a correlation coefficient (R) of 0.032 and weighted average of 10.3%, a difference of 24.5%.
Unemployment Among Ages 20 to 24 years Correlation Summary
| Measurement | Immigrants from Dominica | Immigrants from Eastern Asia |
| Minimum | 0.30% | 5.5% |
| Maximum | 25.8% | 18.7% |
| Range | 25.5% | 13.2% |
| Mean | 12.1% | 10.1% |
| Median | 12.2% | 9.9% |
| Interquartile 25% (IQ1) | 9.7% | 8.8% |
| Interquartile 75% (IQ3) | 15.8% | 11.0% |
| Interquartile Range (IQR) | 6.1% | 2.2% |
| Standard Deviation (Sample) | 5.5% | 2.5% |
| Standard Deviation (Population) | 5.4% | 2.5% |
Similar Demographics by Unemployment Among Ages 20 to 24 years
Demographics Similar to Immigrants from Dominica by Unemployment Among Ages 20 to 24 years
In terms of unemployment among ages 20 to 24 years, the demographic groups most similar to Immigrants from Dominica are Immigrants from Trinidad and Tobago (12.8%, a difference of 0.12%), Barbadian (12.9%, a difference of 0.37%), West Indian (12.8%, a difference of 0.48%), Trinidadian and Tobagonian (12.9%, a difference of 0.63%), and Black/African American (12.7%, a difference of 0.68%).
| Demographics | Rating | Rank | Unemployment Among Ages 20 to 24 years |
| Immigrants | Bangladesh | 0.0 /100 | #309 | Tragic 12.6% |
| Jamaicans | 0.0 /100 | #310 | Tragic 12.6% |
| Vietnamese | 0.0 /100 | #311 | Tragic 12.6% |
| Houma | 0.0 /100 | #312 | Tragic 12.6% |
| Shoshone | 0.0 /100 | #313 | Tragic 12.7% |
| Blacks/African Americans | 0.0 /100 | #314 | Tragic 12.7% |
| West Indians | 0.0 /100 | #315 | Tragic 12.8% |
| Immigrants | Dominica | 0.0 /100 | #316 | Tragic 12.8% |
| Immigrants | Trinidad and Tobago | 0.0 /100 | #317 | Tragic 12.8% |
| Barbadians | 0.0 /100 | #318 | Tragic 12.9% |
| Trinidadians and Tobagonians | 0.0 /100 | #319 | Tragic 12.9% |
| Cheyenne | 0.0 /100 | #320 | Tragic 13.0% |
| Immigrants | Jamaica | 0.0 /100 | #321 | Tragic 13.0% |
| Natives/Alaskans | 0.0 /100 | #322 | Tragic 13.0% |
| Yakama | 0.0 /100 | #323 | Tragic 13.1% |
Demographics Similar to Immigrants from Eastern Asia by Unemployment Among Ages 20 to 24 years
In terms of unemployment among ages 20 to 24 years, the demographic groups most similar to Immigrants from Eastern Asia are Korean (10.3%, a difference of 0.030%), Immigrants from Sweden (10.3%, a difference of 0.070%), Turkish (10.3%, a difference of 0.090%), Ukrainian (10.3%, a difference of 0.10%), and Immigrants from Colombia (10.3%, a difference of 0.13%).
| Demographics | Rating | Rank | Unemployment Among Ages 20 to 24 years |
| Immigrants | Korea | 59.0 /100 | #164 | Average 10.3% |
| Lebanese | 58.3 /100 | #165 | Average 10.3% |
| Italians | 57.7 /100 | #166 | Average 10.3% |
| Immigrants | Fiji | 57.6 /100 | #167 | Average 10.3% |
| Iraqis | 56.7 /100 | #168 | Average 10.3% |
| Immigrants | Colombia | 56.3 /100 | #169 | Average 10.3% |
| Turks | 55.2 /100 | #170 | Average 10.3% |
| Immigrants | Eastern Asia | 52.7 /100 | #171 | Average 10.3% |
| Koreans | 51.9 /100 | #172 | Average 10.3% |
| Immigrants | Sweden | 50.8 /100 | #173 | Average 10.3% |
| Ukrainians | 50.0 /100 | #174 | Average 10.3% |
| Samoans | 45.4 /100 | #175 | Average 10.3% |
| Potawatomi | 42.0 /100 | #176 | Average 10.3% |
| Immigrants | Czechoslovakia | 40.8 /100 | #177 | Average 10.3% |
| Alsatians | 40.5 /100 | #178 | Average 10.3% |