Immigrants from Asia vs Portuguese Unemployment Among Ages 35 to 44 years

COMPARE

Immigrants from Asia
Race
Ancestry
AfghanAfricanAlaska NativeAlaskan AthabascanAlbanianAleutAlsatianAmericanApacheArabArapahoArgentineanArmenianAssyrian/Chaldean/SyriacAustralianAustrianBahamianBangladeshiBarbadianBasqueBelgianBelizeanBermudanBhutaneseBlackfeetBolivianBrazilianBritishBritish West IndianBulgarianBurmeseCajunCambodianCanadianCape VerdeanCarpatho RusynCelticCentral AmericanCentral American IndianCherokeeCheyenneChickasawChileanChineseChippewaChoctawColombianColvilleComancheCosta RicanCreeCreekCroatianCrowCubanCypriotCzechCzechoslovakianDanishDelawareDominicanDutchDutch West IndianEastern EuropeanEcuadorianEgyptianEnglishEstonianEthiopianEuropeanFijianFilipinoFinnishFrenchFrench American IndianFrench CanadianGermanGerman RussianGhanaianGreekGuamanian/ChamorroGuatemalanGuyaneseHaitianHmongHonduranHopiHoumaHungarianIcelanderIndian (Asian)IndonesianInupiatIranianIraqiIrishIroquoisIsraeliItalianJamaicanJapaneseJordanianKenyanKiowaKoreanLaotianLatvianLebaneseLiberianLithuanianLumbeeLuxembourgerMacedonianMalaysianMalteseMarshalleseMenomineeMexicanMexican American IndianMongolianMoroccanNative HawaiianNavajoNepaleseNew ZealanderNicaraguanNigerianNorthern EuropeanNorwegianOkinawanOsageOttawaPaiutePakistaniPalestinianPanamanianParaguayanPennsylvania GermanPeruvianPimaPolishPotawatomiPuebloPuerto RicanPuget Sound SalishRomanianRussianSalvadoranSamoanScandinavianScotch-IrishScottishSeminoleSenegaleseSerbianShoshoneSierra LeoneanSiouxSlavicSlovakSloveneSomaliSouth AfricanSouth AmericanSouth American IndianSoviet UnionSpaniardSpanishSpanish AmericanSpanish American IndianSri LankanSubsaharan AfricanSudaneseSwedishSwissSyrianTaiwaneseThaiTlingit-HaidaTohono O'OdhamTonganTrinidadian and TobagonianTsimshianTurkishU.S. Virgin IslanderUgandanUkrainianUruguayanUteVenezuelanVietnameseWelshWest IndianYakamaYaquiYugoslavianYumanYup'ikZimbabwean
Immigration
NonimmigrantsImmigrantsAfghanistanAfricaAlbaniaArgentinaArmeniaAsiaAustraliaAustriaBahamasBangladeshBarbadosBelarusBelgiumBelizeBoliviaBosnia and HerzegovinaBrazilBulgariaBurma/MyanmarCabo VerdeCambodiaCameroonCanadaCaribbeanCentral AmericaChileChinaColombiaCongoCosta RicaCroatiaCubaCzechoslovakiaDenmarkDominicaDominican RepublicEastern AfricaEastern AsiaEastern EuropeEcuadorEgyptEl SalvadorEnglandEritreaEthiopiaEuropeFijiFranceGermanyGhanaGreeceGrenadaGuatemalaGuyanaHaitiHondurasHong KongHungaryIndiaIndonesiaIranIraqIrelandIsraelItalyJamaicaJapanJordanKazakhstanKenyaKoreaKuwaitLaosLatin AmericaLatviaLebanonLiberiaLithuaniaMalaysiaMexicoMicronesiaMiddle AfricaMoldovaMoroccoNepalNetherlandsNicaraguaNigeriaNorth AmericaNorth MacedoniaNorthern AfricaNorthern EuropeNorwayOceaniaPakistanPanamaPeruPhilippinesPolandPortugalRomaniaRussiaSaudi ArabiaScotlandSenegalSerbiaSierra LeoneSingaporeSomaliaSouth AfricaSouth AmericaSouth Central AsiaSouth Eastern AsiaSouthern EuropeSpainSri LankaSt. Vincent and the GrenadinesSudanSwedenSwitzerlandSyriaTaiwanThailandTrinidad and TobagoTurkeyUgandaUkraineUruguayUzbekistanVenezuelaVietnamWest IndiesWestern AfricaWestern AsiaWestern EuropeYemenZaireZimbabweAzores
Portuguese
Race
Ancestry
AfghanAfricanAlaska NativeAlaskan AthabascanAlbanianAleutAlsatianAmericanApacheArabArapahoArgentineanArmenianAssyrian/Chaldean/SyriacAustralianAustrianBahamianBangladeshiBarbadianBasqueBelgianBelizeanBermudanBhutaneseBlackfeetBolivianBrazilianBritishBritish West IndianBulgarianBurmeseCajunCambodianCanadianCape VerdeanCarpatho RusynCelticCentral AmericanCentral American IndianCherokeeCheyenneChickasawChileanChineseChippewaChoctawColombianColvilleComancheCosta RicanCreeCreekCroatianCrowCubanCypriotCzechCzechoslovakianDanishDelawareDominicanDutchDutch West IndianEastern EuropeanEcuadorianEgyptianEnglishEstonianEthiopianEuropeanFijianFilipinoFinnishFrenchFrench American IndianFrench CanadianGermanGerman RussianGhanaianGreekGuamanian/ChamorroGuatemalanGuyaneseHaitianHmongHonduranHopiHoumaHungarianIcelanderIndian (Asian)IndonesianInupiatIranianIraqiIrishIroquoisIsraeliItalianJamaicanJapaneseJordanianKenyanKiowaKoreanLaotianLatvianLebaneseLiberianLithuanianLumbeeLuxembourgerMacedonianMalaysianMalteseMarshalleseMenomineeMexicanMexican American IndianMongolianMoroccanNative HawaiianNavajoNepaleseNew ZealanderNicaraguanNigerianNorthern EuropeanNorwegianOkinawanOsageOttawaPaiutePakistaniPalestinianPanamanianParaguayanPennsylvania GermanPeruvianPimaPolishPortuguesePotawatomiPuebloPuerto RicanPuget Sound SalishRomanianRussianSalvadoranSamoanScandinavianScotch-IrishScottishSeminoleSenegaleseSerbianShoshoneSierra LeoneanSiouxSlavicSlovakSloveneSomaliSouth AfricanSouth AmericanSouth American IndianSoviet UnionSpaniardSpanishSpanish AmericanSpanish American IndianSri LankanSubsaharan AfricanSudaneseSwedishSwissSyrianTaiwaneseThaiTlingit-HaidaTohono O'OdhamTonganTrinidadian and TobagonianTsimshianTurkishU.S. Virgin IslanderUgandanUkrainianUruguayanUteVenezuelanVietnameseWelshWest IndianYakamaYaquiYugoslavianYumanYup'ikZimbabwean
Immigration
NonimmigrantsImmigrantsAfghanistanAfricaAlbaniaArgentinaArmeniaAustraliaAustriaBahamasBangladeshBarbadosBelarusBelgiumBelizeBoliviaBosnia and HerzegovinaBrazilBulgariaBurma/MyanmarCabo VerdeCambodiaCameroonCanadaCaribbeanCentral AmericaChileChinaColombiaCongoCosta RicaCroatiaCubaCzechoslovakiaDenmarkDominicaDominican RepublicEastern AfricaEastern AsiaEastern EuropeEcuadorEgyptEl SalvadorEnglandEritreaEthiopiaEuropeFijiFranceGermanyGhanaGreeceGrenadaGuatemalaGuyanaHaitiHondurasHong KongHungaryIndiaIndonesiaIranIraqIrelandIsraelItalyJamaicaJapanJordanKazakhstanKenyaKoreaKuwaitLaosLatin AmericaLatviaLebanonLiberiaLithuaniaMalaysiaMexicoMicronesiaMiddle AfricaMoldovaMoroccoNepalNetherlandsNicaraguaNigeriaNorth AmericaNorth MacedoniaNorthern AfricaNorthern EuropeNorwayOceaniaPakistanPanamaPeruPhilippinesPolandPortugalRomaniaRussiaSaudi ArabiaScotlandSenegalSerbiaSierra LeoneSingaporeSomaliaSouth AfricaSouth AmericaSouth Central AsiaSouth Eastern AsiaSouthern EuropeSpainSri LankaSt. Vincent and the GrenadinesSudanSwedenSwitzerlandSyriaTaiwanThailandTrinidad and TobagoTurkeyUgandaUkraineUruguayUzbekistanVenezuelaVietnamWest IndiesWestern AfricaWestern AsiaWestern EuropeYemenZaireZimbabweAzores
Unemployment Among Ages 35 to 44 years
Income
Poverty
Unemployment
Labor Participation
Family Structure
Vehicle Availability
Education Level
Disability

Unemployment Among Ages 35 to 44 years Comparison

Immigrants from Asia

Portuguese

Exceptional
Tragic
4.4%
UNEMPLOYMENT AMONG AGES 35 TO 44 YEARS
95.6/ 100
METRIC RATING
82nd/ 347
METRIC RANK
5.1%
UNEMPLOYMENT AMONG AGES 35 TO 44 YEARS
1.1/ 100
METRIC RATING
234th/ 347
METRIC RANK

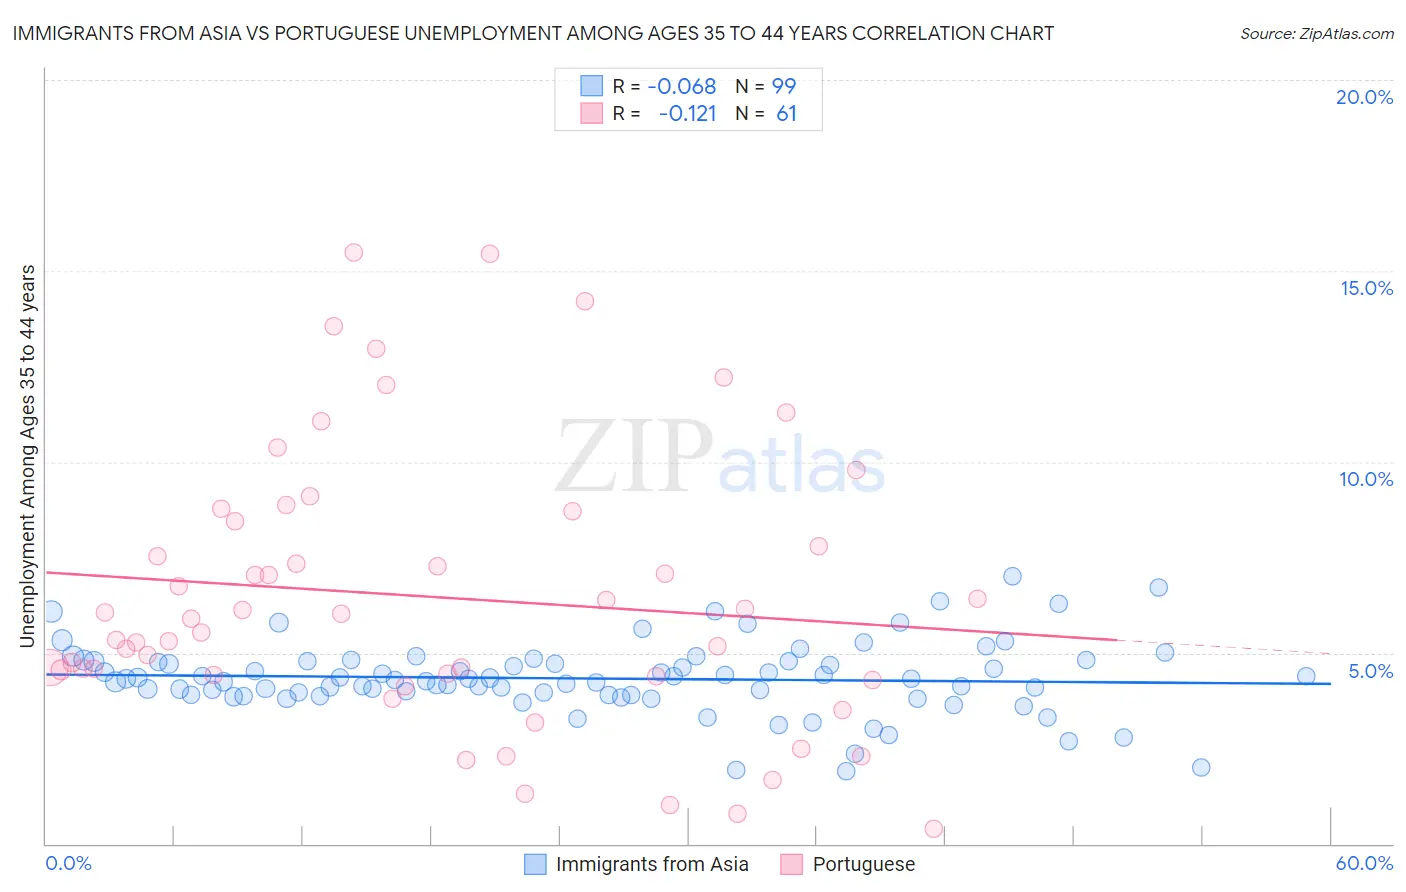
Immigrants from Asia vs Portuguese Unemployment Among Ages 35 to 44 years Correlation Chart

The statistical analysis conducted on geographies consisting of 520,063,038 people shows a slight negative correlation between the proportion of Immigrants from Asia and unemployment rate among population between the ages 35 and 44 in the United States with a correlation coefficient (R) of -0.068 and weighted average of 4.4%. Similarly, the statistical analysis conducted on geographies consisting of 435,170,607 people shows a poor negative correlation between the proportion of Portuguese and unemployment rate among population between the ages 35 and 44 in the United States with a correlation coefficient (R) of -0.121 and weighted average of 5.1%, a difference of 14.2%.
Immigrants from Asia vs Portuguese Unemployment Among Ages 35 to 44 years

Unemployment Among Ages 35 to 44 years Correlation Summary

MeasurementImmigrants from AsiaPortuguese
Minimum1.9%0.40%
Maximum7.0%15.5%
Range5.1%15.1%
Mean4.3%6.5%
Median4.3%5.9%
Interquartile 25% (IQ1)3.9%4.4%
Interquartile 75% (IQ3)4.8%8.6%
Interquartile Range (IQR)0.88%4.2%
Standard Deviation (Sample)0.93%3.6%
Standard Deviation (Population)0.92%3.6%

Similar Demographics by Unemployment Among Ages 35 to 44 years

Demographics Similar to Immigrants from Asia by Unemployment Among Ages 35 to 44 years

In terms of unemployment among ages 35 to 44 years, the demographic groups most similar to Immigrants from Asia are Immigrants from Scotland (4.4%, a difference of 0.010%), Kenyan (4.4%, a difference of 0.050%), Immigrants from Sweden (4.4%, a difference of 0.12%), Immigrants from Australia (4.4%, a difference of 0.14%), and Indian (Asian) (4.4%, a difference of 0.17%).
DemographicsRating | RankUnemployment Among Ages 35 to 44 years
Immigrants | Romania
96.3
/100
|
#75
Exceptional
4.4%
Immigrants | Jordan
96.3
/100
|
#76
Exceptional
4.4%
Dutch
96.1
/100
|
#77
Exceptional
4.4%
Indians (Asian)
96.0
/100
|
#78
Exceptional
4.4%
Immigrants | Sweden
95.9
/100
|
#79
Exceptional
4.4%
Kenyans
95.7
/100
|
#80
Exceptional
4.4%
Immigrants | Scotland
95.6
/100
|
#81
Exceptional
4.4%
Immigrants | Asia
95.6
/100
|
#82
Exceptional
4.4%
Immigrants | Australia
95.3
/100
|
#83
Exceptional
4.4%
Immigrants | Chile
95.2
/100
|
#84
Exceptional
4.4%
Immigrants | Kenya
95.0
/100
|
#85
Exceptional
4.4%
Serbians
94.9
/100
|
#86
Exceptional
4.4%
Immigrants | Bosnia and Herzegovina
94.8
/100
|
#87
Exceptional
4.4%
Immigrants | Latvia
94.8
/100
|
#88
Exceptional
4.4%
Egyptians
94.5
/100
|
#89
Exceptional
4.5%

Demographics Similar to Portuguese by Unemployment Among Ages 35 to 44 years

In terms of unemployment among ages 35 to 44 years, the demographic groups most similar to Portuguese are Immigrants from Nigeria (5.1%, a difference of 0.060%), Iroquois (5.1%, a difference of 0.11%), Japanese (5.1%, a difference of 0.19%), Liberian (5.1%, a difference of 0.22%), and Guamanian/Chamorro (5.1%, a difference of 0.26%).
DemographicsRating | RankUnemployment Among Ages 35 to 44 years
Immigrants | Uzbekistan
1.9
/100
|
#227
Tragic
5.0%
Samoans
1.8
/100
|
#228
Tragic
5.0%
Immigrants | Cambodia
1.5
/100
|
#229
Tragic
5.0%
Liberians
1.3
/100
|
#230
Tragic
5.1%
Japanese
1.2
/100
|
#231
Tragic
5.1%
Iroquois
1.2
/100
|
#232
Tragic
5.1%
Immigrants | Nigeria
1.2
/100
|
#233
Tragic
5.1%
Portuguese
1.1
/100
|
#234
Tragic
5.1%
Guamanians/Chamorros
0.9
/100
|
#235
Tragic
5.1%
Central Americans
0.8
/100
|
#236
Tragic
5.1%
Kiowa
0.8
/100
|
#237
Tragic
5.1%
Hondurans
0.7
/100
|
#238
Tragic
5.1%
Nigerians
0.7
/100
|
#239
Tragic
5.1%
Somalis
0.7
/100
|
#240
Tragic
5.1%
Immigrants | Honduras
0.6
/100
|
#241
Tragic
5.1%