White/Caucasian vs Immigrants from Czechoslovakia Unemployment Among Ages 35 to 44 years
COMPARE
White/Caucasian
Immigrants from Czechoslovakia
Unemployment Among Ages 35 to 44 years
Unemployment Among Ages 35 to 44 years Comparison
Whites/Caucasians
Immigrants from Czechoslovakia
4.6%
UNEMPLOYMENT AMONG AGES 35 TO 44 YEARS
64.9/ 100
METRIC RATING
155th/ 347
METRIC RANK
4.5%
UNEMPLOYMENT AMONG AGES 35 TO 44 YEARS
89.2/ 100
METRIC RATING
112th/ 347
METRIC RANK
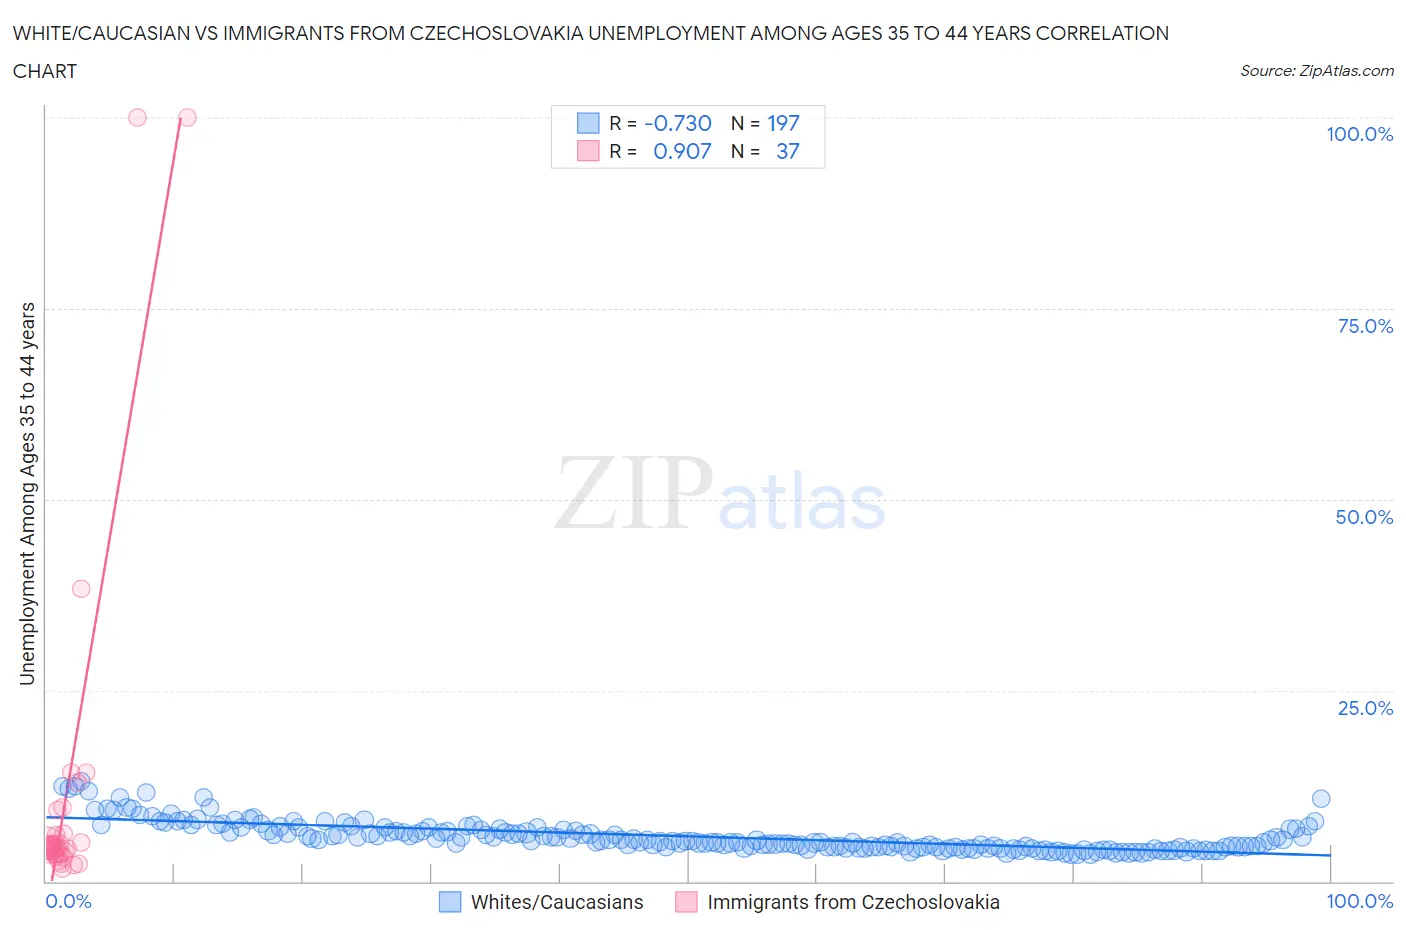
White/Caucasian vs Immigrants from Czechoslovakia Unemployment Among Ages 35 to 44 years Correlation Chart
The statistical analysis conducted on geographies consisting of 539,752,608 people shows a strong negative correlation between the proportion of Whites/Caucasians and unemployment rate among population between the ages 35 and 44 in the United States with a correlation coefficient (R) of -0.730 and weighted average of 4.6%. Similarly, the statistical analysis conducted on geographies consisting of 193,308,245 people shows a near-perfect positive correlation between the proportion of Immigrants from Czechoslovakia and unemployment rate among population between the ages 35 and 44 in the United States with a correlation coefficient (R) of 0.907 and weighted average of 4.5%, a difference of 2.8%.
Unemployment Among Ages 35 to 44 years Correlation Summary
| Measurement | White/Caucasian | Immigrants from Czechoslovakia |
| Minimum | 3.6% | 1.7% |
| Maximum | 13.1% | 100.0% |
| Range | 9.5% | 98.3% |
| Mean | 5.9% | 11.2% |
| Median | 5.3% | 4.4% |
| Interquartile 25% (IQ1) | 4.4% | 3.6% |
| Interquartile 75% (IQ3) | 6.8% | 6.2% |
| Interquartile Range (IQR) | 2.3% | 2.6% |
| Standard Deviation (Sample) | 2.0% | 22.4% |
| Standard Deviation (Population) | 2.0% | 22.1% |
Similar Demographics by Unemployment Among Ages 35 to 44 years
Demographics Similar to Whites/Caucasians by Unemployment Among Ages 35 to 44 years
In terms of unemployment among ages 35 to 44 years, the demographic groups most similar to Whites/Caucasians are Immigrants from Western Europe (4.6%, a difference of 0.050%), South American (4.6%, a difference of 0.090%), Immigrants from Belarus (4.6%, a difference of 0.11%), Immigrants from Iran (4.6%, a difference of 0.14%), and Albanian (4.6%, a difference of 0.15%).
| Demographics | Rating | Rank | Unemployment Among Ages 35 to 44 years |
| Slavs | 72.4 /100 | #148 | Good 4.6% |
| Immigrants | Burma/Myanmar | 72.2 /100 | #149 | Good 4.6% |
| Immigrants | England | 70.5 /100 | #150 | Good 4.6% |
| Puget Sound Salish | 67.1 /100 | #151 | Good 4.6% |
| Pakistanis | 67.1 /100 | #152 | Good 4.6% |
| Immigrants | Brazil | 67.0 /100 | #153 | Good 4.6% |
| Immigrants | Western Europe | 65.5 /100 | #154 | Good 4.6% |
| Whites/Caucasians | 64.9 /100 | #155 | Good 4.6% |
| South Americans | 63.7 /100 | #156 | Good 4.6% |
| Immigrants | Belarus | 63.4 /100 | #157 | Good 4.6% |
| Immigrants | Iran | 63.1 /100 | #158 | Good 4.6% |
| Albanians | 63.0 /100 | #159 | Good 4.6% |
| Hungarians | 62.6 /100 | #160 | Good 4.6% |
| Celtics | 61.7 /100 | #161 | Good 4.7% |
| Costa Ricans | 59.6 /100 | #162 | Average 4.7% |
Demographics Similar to Immigrants from Czechoslovakia by Unemployment Among Ages 35 to 44 years
In terms of unemployment among ages 35 to 44 years, the demographic groups most similar to Immigrants from Czechoslovakia are Immigrants from Nicaragua (4.5%, a difference of 0.13%), Immigrants from Italy (4.5%, a difference of 0.15%), Immigrants from Kazakhstan (4.5%, a difference of 0.16%), Macedonian (4.5%, a difference of 0.17%), and Maltese (4.5%, a difference of 0.19%).
| Demographics | Rating | Rank | Unemployment Among Ages 35 to 44 years |
| Immigrants | Saudi Arabia | 91.3 /100 | #105 | Exceptional 4.5% |
| Immigrants | North America | 91.1 /100 | #106 | Exceptional 4.5% |
| Immigrants | North Macedonia | 90.7 /100 | #107 | Exceptional 4.5% |
| New Zealanders | 90.3 /100 | #108 | Exceptional 4.5% |
| Romanians | 90.3 /100 | #109 | Exceptional 4.5% |
| Immigrants | Kazakhstan | 90.0 /100 | #110 | Excellent 4.5% |
| Immigrants | Nicaragua | 89.8 /100 | #111 | Excellent 4.5% |
| Immigrants | Czechoslovakia | 89.2 /100 | #112 | Excellent 4.5% |
| Immigrants | Italy | 88.4 /100 | #113 | Excellent 4.5% |
| Macedonians | 88.3 /100 | #114 | Excellent 4.5% |
| Maltese | 88.1 /100 | #115 | Excellent 4.5% |
| Immigrants | Israel | 88.1 /100 | #116 | Excellent 4.5% |
| Immigrants | Greece | 87.9 /100 | #117 | Excellent 4.5% |
| Irish | 87.9 /100 | #118 | Excellent 4.5% |
| Nicaraguans | 87.6 /100 | #119 | Excellent 4.5% |