Taiwanese vs Central American Indian Unemployment Among Ages 20 to 24 years
COMPARE
Taiwanese
Central American Indian
Unemployment Among Ages 20 to 24 years
Unemployment Among Ages 20 to 24 years Comparison
Taiwanese
Central American Indians
9.4%
UNEMPLOYMENT AMONG AGES 20 TO 24 YEARS
100.0/ 100
METRIC RATING
24th/ 347
METRIC RANK
11.9%
UNEMPLOYMENT AMONG AGES 20 TO 24 YEARS
0.0/ 100
METRIC RATING
291st/ 347
METRIC RANK
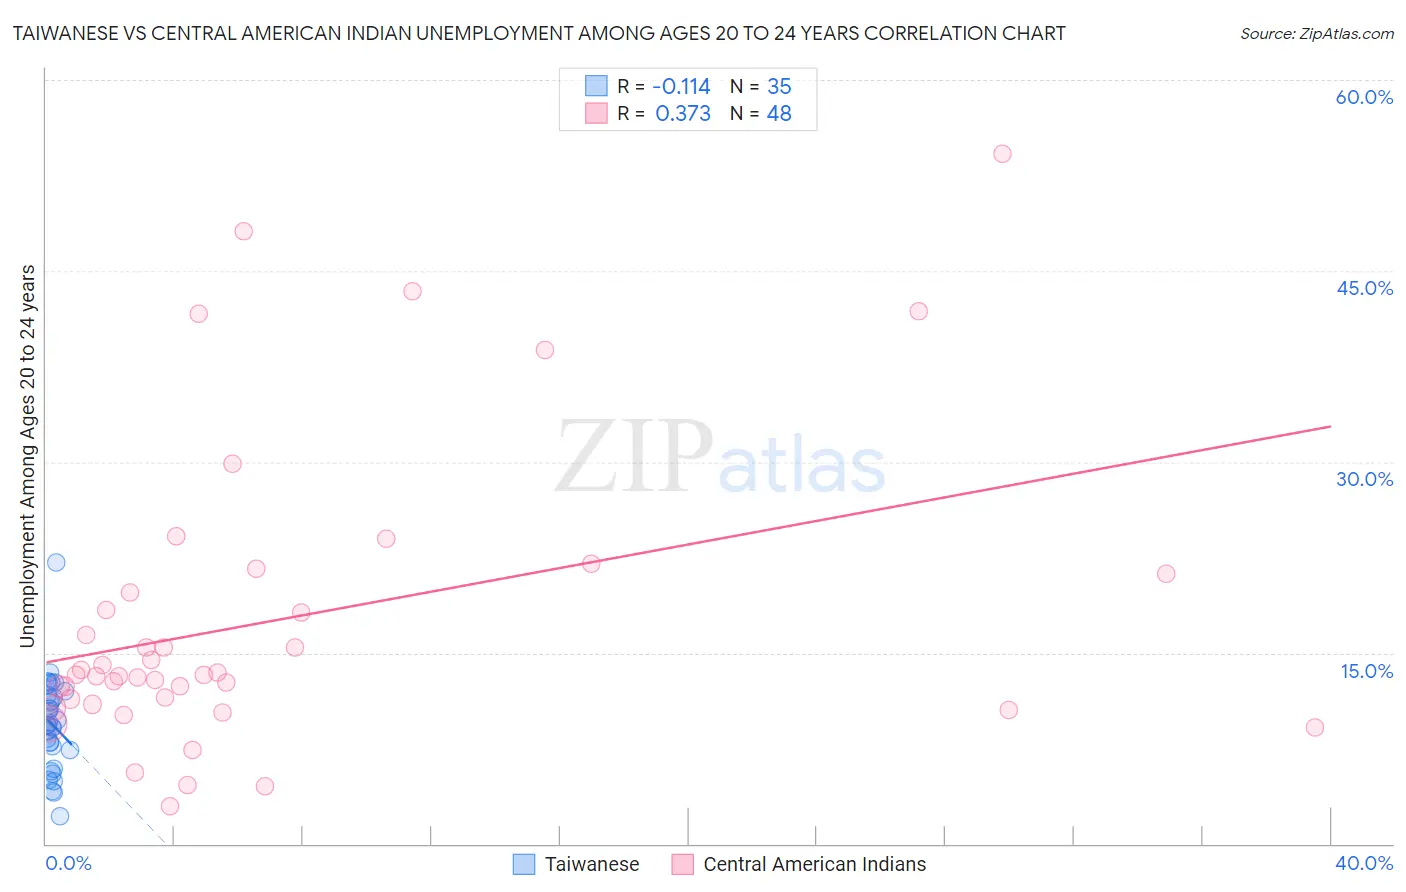
Taiwanese vs Central American Indian Unemployment Among Ages 20 to 24 years Correlation Chart
The statistical analysis conducted on geographies consisting of 31,679,068 people shows a poor negative correlation between the proportion of Taiwanese and unemployment rate among population between the ages 20 and 24 in the United States with a correlation coefficient (R) of -0.114 and weighted average of 9.4%. Similarly, the statistical analysis conducted on geographies consisting of 320,123,925 people shows a mild positive correlation between the proportion of Central American Indians and unemployment rate among population between the ages 20 and 24 in the United States with a correlation coefficient (R) of 0.373 and weighted average of 11.9%, a difference of 26.2%.
Unemployment Among Ages 20 to 24 years Correlation Summary
| Measurement | Taiwanese | Central American Indian |
| Minimum | 2.2% | 2.9% |
| Maximum | 22.1% | 54.2% |
| Range | 19.9% | 51.3% |
| Mean | 9.4% | 17.6% |
| Median | 9.4% | 13.3% |
| Interquartile 25% (IQ1) | 7.4% | 11.2% |
| Interquartile 75% (IQ3) | 11.7% | 20.5% |
| Interquartile Range (IQR) | 4.3% | 9.3% |
| Standard Deviation (Sample) | 3.7% | 11.7% |
| Standard Deviation (Population) | 3.6% | 11.6% |
Similar Demographics by Unemployment Among Ages 20 to 24 years
Demographics Similar to Taiwanese by Unemployment Among Ages 20 to 24 years
In terms of unemployment among ages 20 to 24 years, the demographic groups most similar to Taiwanese are Immigrants from Eritrea (9.5%, a difference of 0.25%), Swedish (9.5%, a difference of 0.25%), Tongan (9.4%, a difference of 0.31%), Immigrants from Nepal (9.4%, a difference of 0.31%), and Immigrants from Bosnia and Herzegovina (9.4%, a difference of 0.58%).
| Demographics | Rating | Rank | Unemployment Among Ages 20 to 24 years |
| Czechs | 100.0 /100 | #17 | Exceptional 9.3% |
| Chinese | 100.0 /100 | #18 | Exceptional 9.4% |
| Hmong | 100.0 /100 | #19 | Exceptional 9.4% |
| Osage | 100.0 /100 | #20 | Exceptional 9.4% |
| Immigrants | Bosnia and Herzegovina | 100.0 /100 | #21 | Exceptional 9.4% |
| Tongans | 100.0 /100 | #22 | Exceptional 9.4% |
| Immigrants | Nepal | 100.0 /100 | #23 | Exceptional 9.4% |
| Taiwanese | 100.0 /100 | #24 | Exceptional 9.4% |
| Immigrants | Eritrea | 100.0 /100 | #25 | Exceptional 9.5% |
| Swedes | 100.0 /100 | #26 | Exceptional 9.5% |
| Immigrants | Zimbabwe | 100.0 /100 | #27 | Exceptional 9.5% |
| Immigrants | Afghanistan | 100.0 /100 | #28 | Exceptional 9.5% |
| Immigrants | North Macedonia | 100.0 /100 | #29 | Exceptional 9.5% |
| Scandinavians | 100.0 /100 | #30 | Exceptional 9.5% |
| Immigrants | Eastern Africa | 100.0 /100 | #31 | Exceptional 9.5% |
Demographics Similar to Central American Indians by Unemployment Among Ages 20 to 24 years
In terms of unemployment among ages 20 to 24 years, the demographic groups most similar to Central American Indians are Immigrants from Senegal (11.9%, a difference of 0.080%), Immigrants from Ghana (11.9%, a difference of 0.31%), Immigrants from Belize (12.0%, a difference of 0.34%), Immigrants from Armenia (12.0%, a difference of 0.52%), and Cajun (12.0%, a difference of 0.55%).
| Demographics | Rating | Rank | Unemployment Among Ages 20 to 24 years |
| Immigrants | Western Africa | 0.0 /100 | #284 | Tragic 11.7% |
| Soviet Union | 0.0 /100 | #285 | Tragic 11.7% |
| Ecuadorians | 0.0 /100 | #286 | Tragic 11.8% |
| Immigrants | Ecuador | 0.0 /100 | #287 | Tragic 11.8% |
| U.S. Virgin Islanders | 0.0 /100 | #288 | Tragic 11.8% |
| Belizeans | 0.0 /100 | #289 | Tragic 11.8% |
| Immigrants | Caribbean | 0.0 /100 | #290 | Tragic 11.8% |
| Central American Indians | 0.0 /100 | #291 | Tragic 11.9% |
| Immigrants | Senegal | 0.0 /100 | #292 | Tragic 11.9% |
| Immigrants | Ghana | 0.0 /100 | #293 | Tragic 11.9% |
| Immigrants | Belize | 0.0 /100 | #294 | Tragic 12.0% |
| Immigrants | Armenia | 0.0 /100 | #295 | Tragic 12.0% |
| Cajuns | 0.0 /100 | #296 | Tragic 12.0% |
| Blackfeet | 0.0 /100 | #297 | Tragic 12.0% |
| Lumbee | 0.0 /100 | #298 | Tragic 12.0% |