White/Caucasian vs Celtic Unemployment Among Women with Children Under 18 years
COMPARE
White/Caucasian
Celtic
Unemployment Among Women with Children Under 18 years
Unemployment Among Women with Children Under 18 years Comparison
Whites/Caucasians
Celtics
5.3%
UNEMPLOYMENT AMONG WOMEN WITH CHILDREN UNDER 18 YEARS
82.9/ 100
METRIC RATING
127th/ 347
METRIC RANK
5.4%
UNEMPLOYMENT AMONG WOMEN WITH CHILDREN UNDER 18 YEARS
63.0/ 100
METRIC RATING
164th/ 347
METRIC RANK
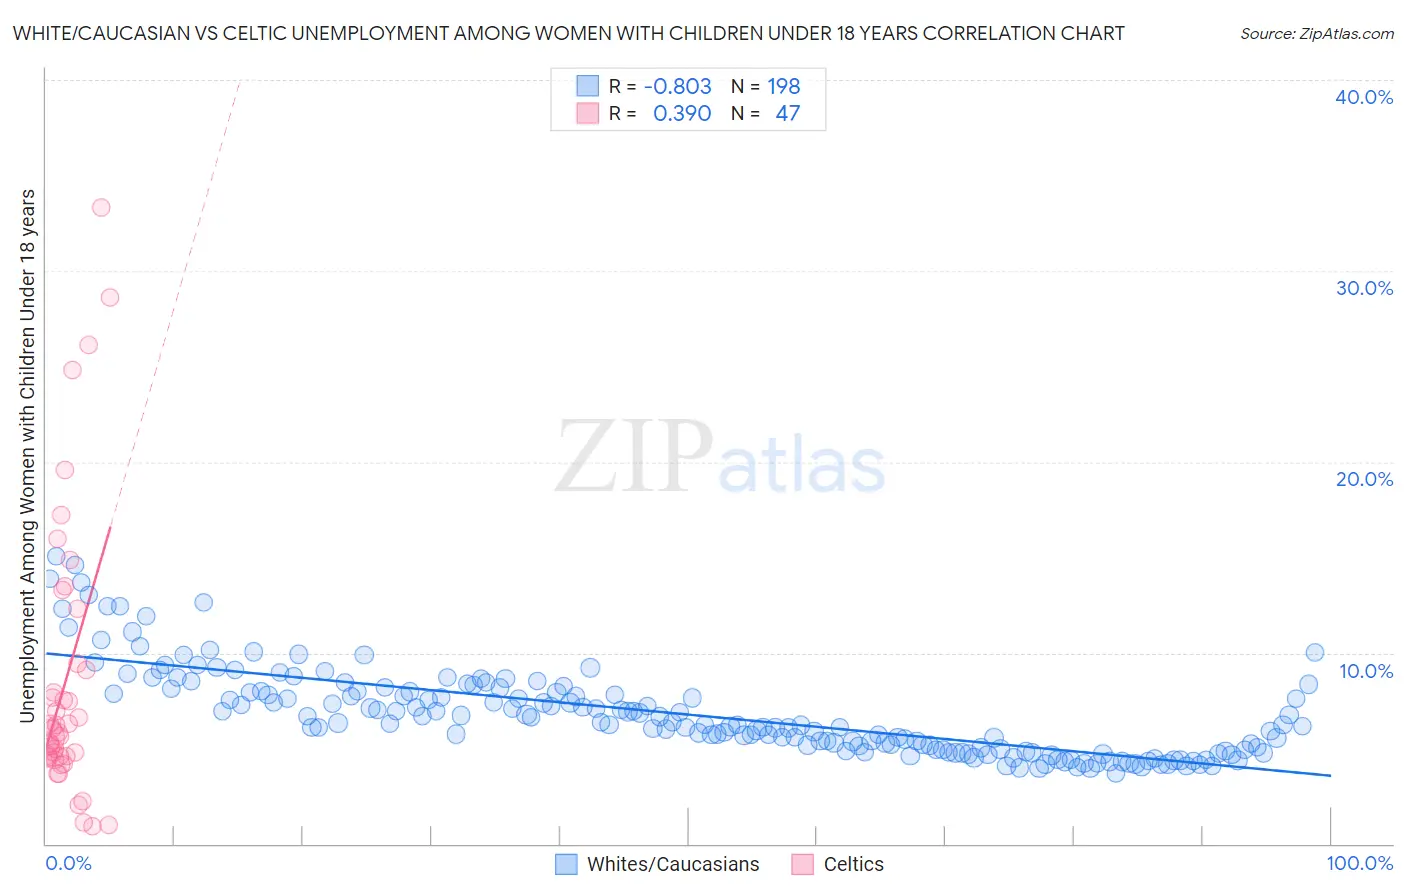
White/Caucasian vs Celtic Unemployment Among Women with Children Under 18 years Correlation Chart
The statistical analysis conducted on geographies consisting of 523,047,491 people shows a very strong negative correlation between the proportion of Whites/Caucasians and unemployment rate among women with children under the age of 18 in the United States with a correlation coefficient (R) of -0.803 and weighted average of 5.3%. Similarly, the statistical analysis conducted on geographies consisting of 164,100,084 people shows a mild positive correlation between the proportion of Celtics and unemployment rate among women with children under the age of 18 in the United States with a correlation coefficient (R) of 0.390 and weighted average of 5.4%, a difference of 1.9%.
Unemployment Among Women with Children Under 18 years Correlation Summary
| Measurement | White/Caucasian | Celtic |
| Minimum | 3.7% | 0.90% |
| Maximum | 15.1% | 33.3% |
| Range | 11.4% | 32.4% |
| Mean | 6.8% | 8.6% |
| Median | 6.2% | 5.8% |
| Interquartile 25% (IQ1) | 4.9% | 4.5% |
| Interquartile 75% (IQ3) | 8.0% | 9.4% |
| Interquartile Range (IQR) | 3.0% | 4.9% |
| Standard Deviation (Sample) | 2.3% | 7.4% |
| Standard Deviation (Population) | 2.3% | 7.3% |
Similar Demographics by Unemployment Among Women with Children Under 18 years
Demographics Similar to Whites/Caucasians by Unemployment Among Women with Children Under 18 years
In terms of unemployment among women with children under 18 years, the demographic groups most similar to Whites/Caucasians are Immigrants from South Africa (5.3%, a difference of 0.010%), Immigrants from Oceania (5.3%, a difference of 0.030%), Immigrants from North Macedonia (5.3%, a difference of 0.040%), Immigrants from Italy (5.3%, a difference of 0.070%), and Immigrants from Austria (5.3%, a difference of 0.10%).
| Demographics | Rating | Rank | Unemployment Among Women with Children Under 18 years |
| Egyptians | 86.4 /100 | #120 | Excellent 5.3% |
| Immigrants | Romania | 85.8 /100 | #121 | Excellent 5.3% |
| Scotch-Irish | 85.7 /100 | #122 | Excellent 5.3% |
| Sudanese | 84.3 /100 | #123 | Excellent 5.3% |
| Native Hawaiians | 84.0 /100 | #124 | Excellent 5.3% |
| Immigrants | North Macedonia | 83.2 /100 | #125 | Excellent 5.3% |
| Immigrants | Oceania | 83.1 /100 | #126 | Excellent 5.3% |
| Whites/Caucasians | 82.9 /100 | #127 | Excellent 5.3% |
| Immigrants | South Africa | 82.8 /100 | #128 | Excellent 5.3% |
| Immigrants | Italy | 82.3 /100 | #129 | Excellent 5.3% |
| Immigrants | Austria | 82.1 /100 | #130 | Excellent 5.3% |
| Immigrants | Israel | 81.9 /100 | #131 | Excellent 5.3% |
| Immigrants | Ethiopia | 81.4 /100 | #132 | Excellent 5.3% |
| Ethiopians | 80.7 /100 | #133 | Excellent 5.3% |
| Slovaks | 80.5 /100 | #134 | Excellent 5.3% |
Demographics Similar to Celtics by Unemployment Among Women with Children Under 18 years
In terms of unemployment among women with children under 18 years, the demographic groups most similar to Celtics are Tlingit-Haida (5.4%, a difference of 0.090%), Lebanese (5.4%, a difference of 0.13%), Immigrants from Saudi Arabia (5.4%, a difference of 0.16%), Immigrants from Iraq (5.4%, a difference of 0.23%), and Afghan (5.4%, a difference of 0.28%).
| Demographics | Rating | Rank | Unemployment Among Women with Children Under 18 years |
| German Russians | 70.2 /100 | #157 | Good 5.4% |
| Immigrants | Burma/Myanmar | 69.5 /100 | #158 | Good 5.4% |
| Chickasaw | 68.4 /100 | #159 | Good 5.4% |
| Afghans | 66.6 /100 | #160 | Good 5.4% |
| Immigrants | Iraq | 65.9 /100 | #161 | Good 5.4% |
| Immigrants | Saudi Arabia | 65.0 /100 | #162 | Good 5.4% |
| Lebanese | 64.7 /100 | #163 | Good 5.4% |
| Celtics | 63.0 /100 | #164 | Good 5.4% |
| Tlingit-Haida | 61.9 /100 | #165 | Good 5.4% |
| Aleuts | 59.4 /100 | #166 | Average 5.4% |
| Immigrants | Denmark | 58.0 /100 | #167 | Average 5.4% |
| Immigrants | Northern Africa | 56.1 /100 | #168 | Average 5.4% |
| Immigrants | Thailand | 55.3 /100 | #169 | Average 5.4% |
| Samoans | 54.1 /100 | #170 | Average 5.4% |
| Immigrants | Philippines | 53.1 /100 | #171 | Average 5.4% |