West Indian vs Immigrants from Liberia Female Unemployment
COMPARE
West Indian
Immigrants from Liberia
Female Unemployment
Female Unemployment Comparison
West Indians
Immigrants from Liberia
6.1%
FEMALE UNEMPLOYMENT
0.0/ 100
METRIC RATING
297th/ 347
METRIC RANK
5.6%
FEMALE UNEMPLOYMENT
1.5/ 100
METRIC RATING
244th/ 347
METRIC RANK
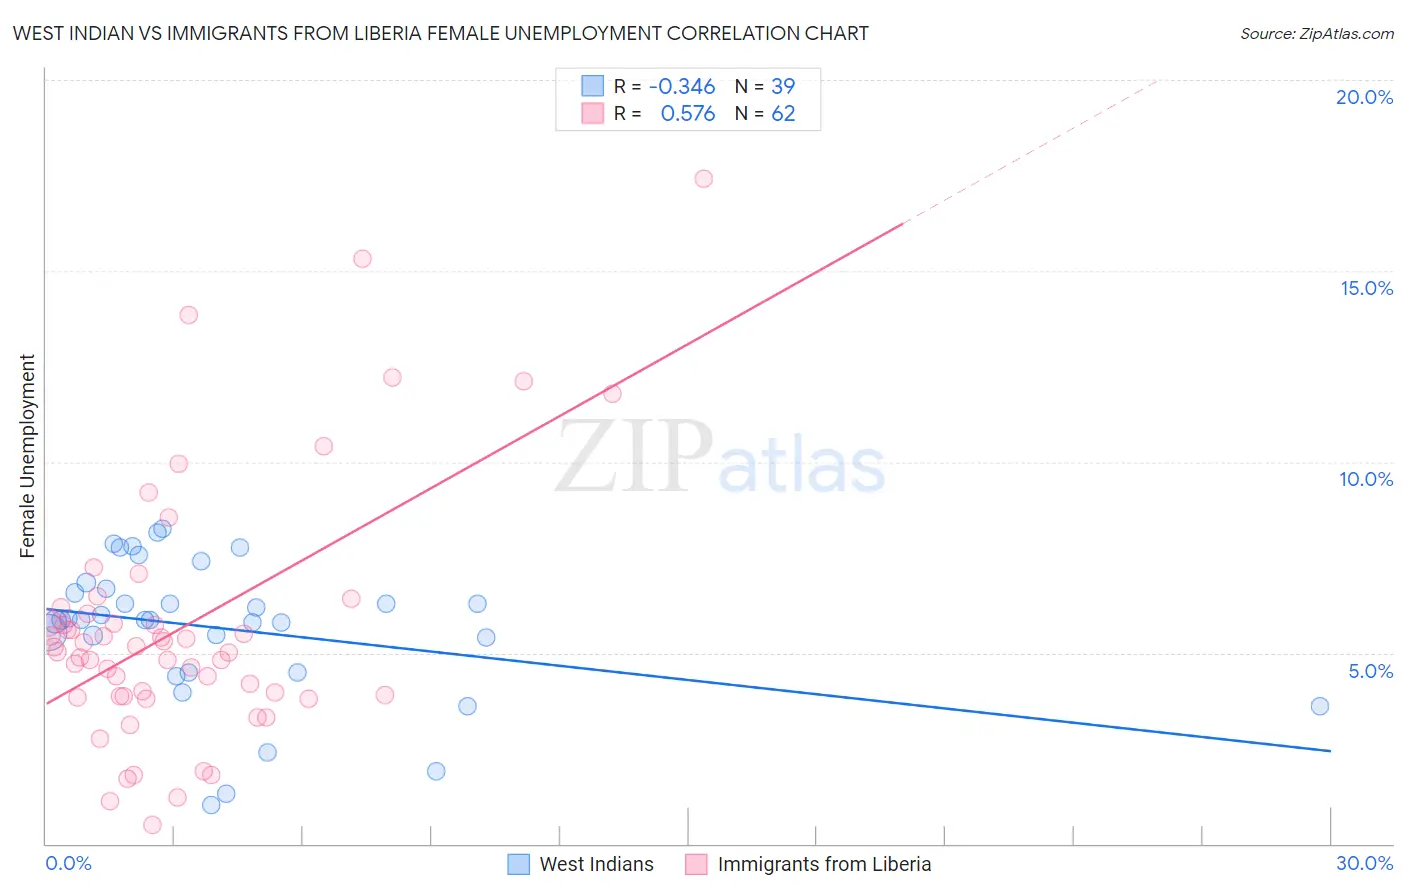
West Indian vs Immigrants from Liberia Female Unemployment Correlation Chart
The statistical analysis conducted on geographies consisting of 253,607,291 people shows a mild negative correlation between the proportion of West Indians and unemploymnet rate among females in the United States with a correlation coefficient (R) of -0.346 and weighted average of 6.1%. Similarly, the statistical analysis conducted on geographies consisting of 135,123,967 people shows a substantial positive correlation between the proportion of Immigrants from Liberia and unemploymnet rate among females in the United States with a correlation coefficient (R) of 0.576 and weighted average of 5.6%, a difference of 9.6%.
Female Unemployment Correlation Summary
| Measurement | West Indian | Immigrants from Liberia |
| Minimum | 1.0% | 0.50% |
| Maximum | 8.3% | 17.4% |
| Range | 7.3% | 16.9% |
| Mean | 5.6% | 5.7% |
| Median | 5.9% | 5.1% |
| Interquartile 25% (IQ1) | 4.5% | 3.9% |
| Interquartile 75% (IQ3) | 6.7% | 6.0% |
| Interquartile Range (IQR) | 2.2% | 2.2% |
| Standard Deviation (Sample) | 1.8% | 3.3% |
| Standard Deviation (Population) | 1.8% | 3.3% |
Similar Demographics by Female Unemployment
Demographics Similar to West Indians by Female Unemployment
In terms of female unemployment, the demographic groups most similar to West Indians are Alaskan Athabascan (6.1%, a difference of 0.010%), Jamaican (6.1%, a difference of 0.020%), Immigrants from Latin America (6.1%, a difference of 0.030%), Immigrants from El Salvador (6.1%, a difference of 0.13%), and Ute (6.1%, a difference of 0.13%).
| Demographics | Rating | Rank | Female Unemployment |
| Immigrants | Caribbean | 0.0 /100 | #290 | Tragic 6.1% |
| Immigrants | West Indies | 0.0 /100 | #291 | Tragic 6.1% |
| Immigrants | Trinidad and Tobago | 0.0 /100 | #292 | Tragic 6.1% |
| Mexicans | 0.0 /100 | #293 | Tragic 6.1% |
| Immigrants | El Salvador | 0.0 /100 | #294 | Tragic 6.1% |
| Immigrants | Latin America | 0.0 /100 | #295 | Tragic 6.1% |
| Alaskan Athabascans | 0.0 /100 | #296 | Tragic 6.1% |
| West Indians | 0.0 /100 | #297 | Tragic 6.1% |
| Jamaicans | 0.0 /100 | #298 | Tragic 6.1% |
| Ute | 0.0 /100 | #299 | Tragic 6.1% |
| Immigrants | Haiti | 0.0 /100 | #300 | Tragic 6.1% |
| Immigrants | Barbados | 0.0 /100 | #301 | Tragic 6.2% |
| U.S. Virgin Islanders | 0.0 /100 | #302 | Tragic 6.2% |
| Barbadians | 0.0 /100 | #303 | Tragic 6.2% |
| Immigrants | Jamaica | 0.0 /100 | #304 | Tragic 6.2% |
Demographics Similar to Immigrants from Liberia by Female Unemployment
In terms of female unemployment, the demographic groups most similar to Immigrants from Liberia are Guamanian/Chamorro (5.6%, a difference of 0.14%), Japanese (5.6%, a difference of 0.37%), Immigrants from Western Asia (5.6%, a difference of 0.45%), Marshallese (5.6%, a difference of 0.55%), and Spanish American (5.6%, a difference of 0.55%).
| Demographics | Rating | Rank | Female Unemployment |
| Immigrants | Panama | 3.2 /100 | #237 | Tragic 5.5% |
| Sierra Leoneans | 3.2 /100 | #238 | Tragic 5.5% |
| Aleuts | 3.0 /100 | #239 | Tragic 5.5% |
| Immigrants | South America | 2.9 /100 | #240 | Tragic 5.5% |
| South American Indians | 2.8 /100 | #241 | Tragic 5.5% |
| Marshallese | 2.3 /100 | #242 | Tragic 5.6% |
| Spanish Americans | 2.2 /100 | #243 | Tragic 5.6% |
| Immigrants | Liberia | 1.5 /100 | #244 | Tragic 5.6% |
| Guamanians/Chamorros | 1.4 /100 | #245 | Tragic 5.6% |
| Japanese | 1.2 /100 | #246 | Tragic 5.6% |
| Immigrants | Western Asia | 1.1 /100 | #247 | Tragic 5.6% |
| Cree | 1.0 /100 | #248 | Tragic 5.6% |
| Immigrants | Uzbekistan | 1.0 /100 | #249 | Tragic 5.6% |
| Immigrants | Syria | 0.8 /100 | #250 | Tragic 5.6% |
| Assyrians/Chaldeans/Syriacs | 0.8 /100 | #251 | Tragic 5.6% |