West Indian vs Samoan Female Unemployment
COMPARE
West Indian
Samoan
Female Unemployment
Female Unemployment Comparison
West Indians
Samoans
6.1%
FEMALE UNEMPLOYMENT
0.0/ 100
METRIC RATING
297th/ 347
METRIC RANK
5.4%
FEMALE UNEMPLOYMENT
10.6/ 100
METRIC RATING
213th/ 347
METRIC RANK
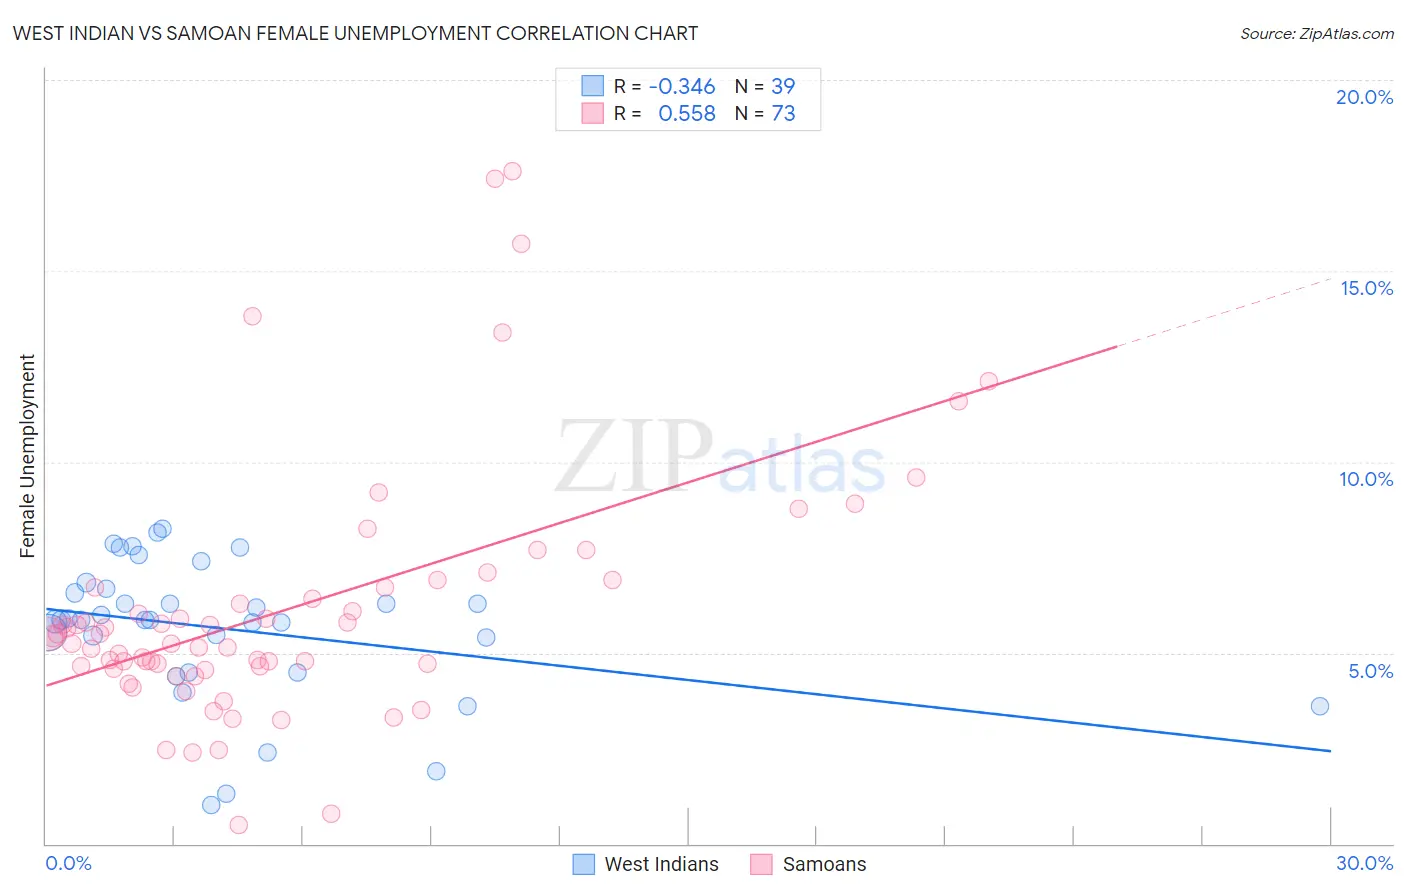
West Indian vs Samoan Female Unemployment Correlation Chart
The statistical analysis conducted on geographies consisting of 253,607,291 people shows a mild negative correlation between the proportion of West Indians and unemploymnet rate among females in the United States with a correlation coefficient (R) of -0.346 and weighted average of 6.1%. Similarly, the statistical analysis conducted on geographies consisting of 224,572,142 people shows a substantial positive correlation between the proportion of Samoans and unemploymnet rate among females in the United States with a correlation coefficient (R) of 0.558 and weighted average of 5.4%, a difference of 12.8%.
Female Unemployment Correlation Summary
| Measurement | West Indian | Samoan |
| Minimum | 1.0% | 0.50% |
| Maximum | 8.3% | 17.6% |
| Range | 7.3% | 17.1% |
| Mean | 5.6% | 6.1% |
| Median | 5.9% | 5.4% |
| Interquartile 25% (IQ1) | 4.5% | 4.6% |
| Interquartile 75% (IQ3) | 6.7% | 6.7% |
| Interquartile Range (IQR) | 2.2% | 2.1% |
| Standard Deviation (Sample) | 1.8% | 3.3% |
| Standard Deviation (Population) | 1.8% | 3.3% |
Similar Demographics by Female Unemployment
Demographics Similar to West Indians by Female Unemployment
In terms of female unemployment, the demographic groups most similar to West Indians are Alaskan Athabascan (6.1%, a difference of 0.010%), Jamaican (6.1%, a difference of 0.020%), Immigrants from Latin America (6.1%, a difference of 0.030%), Immigrants from El Salvador (6.1%, a difference of 0.13%), and Ute (6.1%, a difference of 0.13%).
| Demographics | Rating | Rank | Female Unemployment |
| Immigrants | Caribbean | 0.0 /100 | #290 | Tragic 6.1% |
| Immigrants | West Indies | 0.0 /100 | #291 | Tragic 6.1% |
| Immigrants | Trinidad and Tobago | 0.0 /100 | #292 | Tragic 6.1% |
| Mexicans | 0.0 /100 | #293 | Tragic 6.1% |
| Immigrants | El Salvador | 0.0 /100 | #294 | Tragic 6.1% |
| Immigrants | Latin America | 0.0 /100 | #295 | Tragic 6.1% |
| Alaskan Athabascans | 0.0 /100 | #296 | Tragic 6.1% |
| West Indians | 0.0 /100 | #297 | Tragic 6.1% |
| Jamaicans | 0.0 /100 | #298 | Tragic 6.1% |
| Ute | 0.0 /100 | #299 | Tragic 6.1% |
| Immigrants | Haiti | 0.0 /100 | #300 | Tragic 6.1% |
| Immigrants | Barbados | 0.0 /100 | #301 | Tragic 6.2% |
| U.S. Virgin Islanders | 0.0 /100 | #302 | Tragic 6.2% |
| Barbadians | 0.0 /100 | #303 | Tragic 6.2% |
| Immigrants | Jamaica | 0.0 /100 | #304 | Tragic 6.2% |
Demographics Similar to Samoans by Female Unemployment
In terms of female unemployment, the demographic groups most similar to Samoans are Seminole (5.4%, a difference of 0.050%), Immigrants from Nicaragua (5.4%, a difference of 0.070%), Comanche (5.4%, a difference of 0.090%), Uruguayan (5.4%, a difference of 0.12%), and Ottawa (5.4%, a difference of 0.14%).
| Demographics | Rating | Rank | Female Unemployment |
| Immigrants | Brazil | 18.8 /100 | #206 | Poor 5.4% |
| Creek | 15.4 /100 | #207 | Poor 5.4% |
| Immigrants | Costa Rica | 13.7 /100 | #208 | Poor 5.4% |
| Koreans | 13.4 /100 | #209 | Poor 5.4% |
| Choctaw | 12.3 /100 | #210 | Poor 5.4% |
| Ottawa | 11.6 /100 | #211 | Poor 5.4% |
| Uruguayans | 11.4 /100 | #212 | Poor 5.4% |
| Samoans | 10.6 /100 | #213 | Poor 5.4% |
| Seminole | 10.3 /100 | #214 | Poor 5.4% |
| Immigrants | Nicaragua | 10.2 /100 | #215 | Poor 5.4% |
| Comanche | 10.0 /100 | #216 | Poor 5.4% |
| Peruvians | 9.6 /100 | #217 | Tragic 5.4% |
| Bermudans | 9.0 /100 | #218 | Tragic 5.4% |
| South Americans | 8.6 /100 | #219 | Tragic 5.4% |
| Immigrants | Africa | 8.5 /100 | #220 | Tragic 5.4% |