West Indian vs Immigrants from Bolivia Unemployment Among Women with Children Ages 6 to 17 years
COMPARE
West Indian
Immigrants from Bolivia
Unemployment Among Women with Children Ages 6 to 17 years
Unemployment Among Women with Children Ages 6 to 17 years Comparison
West Indians
Immigrants from Bolivia
9.5%
UNEMPLOYMENT AMONG WOMEN WITH CHILDREN AGES 6 TO 17 YEARS
0.4/ 100
METRIC RATING
265th/ 347
METRIC RANK
8.4%
UNEMPLOYMENT AMONG WOMEN WITH CHILDREN AGES 6 TO 17 YEARS
99.6/ 100
METRIC RATING
81st/ 347
METRIC RANK
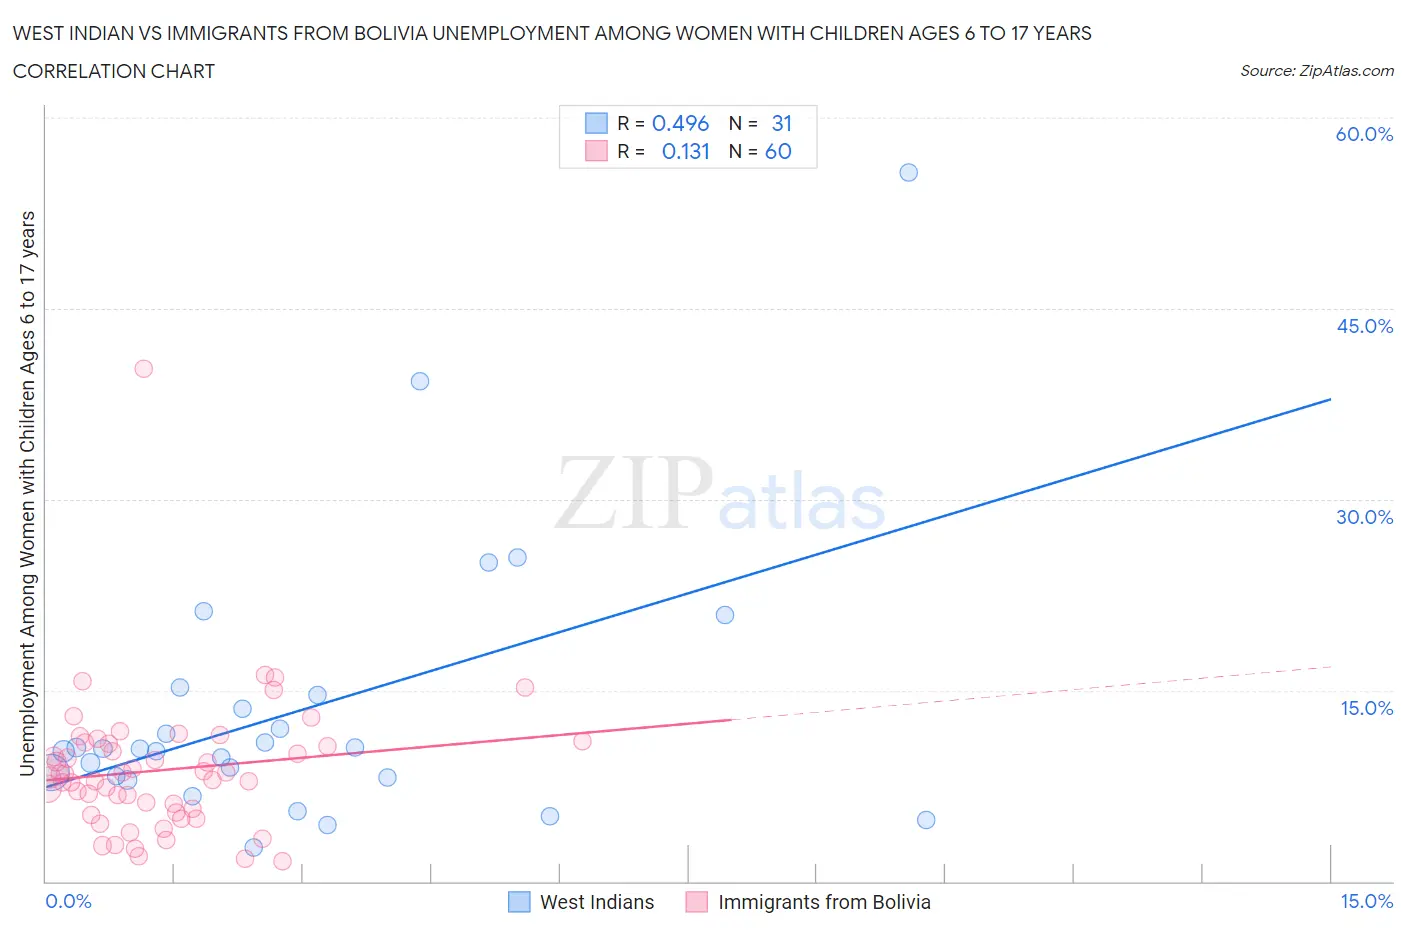
West Indian vs Immigrants from Bolivia Unemployment Among Women with Children Ages 6 to 17 years Correlation Chart
The statistical analysis conducted on geographies consisting of 202,380,945 people shows a moderate positive correlation between the proportion of West Indians and unemployment rate among women with children between the ages 6 and 17 in the United States with a correlation coefficient (R) of 0.496 and weighted average of 9.5%. Similarly, the statistical analysis conducted on geographies consisting of 133,267,206 people shows a poor positive correlation between the proportion of Immigrants from Bolivia and unemployment rate among women with children between the ages 6 and 17 in the United States with a correlation coefficient (R) of 0.131 and weighted average of 8.4%, a difference of 13.1%.
Unemployment Among Women with Children Ages 6 to 17 years Correlation Summary
| Measurement | West Indian | Immigrants from Bolivia |
| Minimum | 2.7% | 1.6% |
| Maximum | 55.7% | 40.2% |
| Range | 53.0% | 38.6% |
| Mean | 13.5% | 8.7% |
| Median | 10.4% | 8.3% |
| Interquartile 25% (IQ1) | 8.2% | 5.6% |
| Interquartile 75% (IQ3) | 14.6% | 10.8% |
| Interquartile Range (IQR) | 6.4% | 5.3% |
| Standard Deviation (Sample) | 10.8% | 5.5% |
| Standard Deviation (Population) | 10.7% | 5.5% |
Similar Demographics by Unemployment Among Women with Children Ages 6 to 17 years
Demographics Similar to West Indians by Unemployment Among Women with Children Ages 6 to 17 years
In terms of unemployment among women with children ages 6 to 17 years, the demographic groups most similar to West Indians are Immigrants from Ghana (9.5%, a difference of 0.030%), Immigrants from Jamaica (9.5%, a difference of 0.16%), Irish (9.5%, a difference of 0.18%), Lebanese (9.5%, a difference of 0.27%), and Senegalese (9.5%, a difference of 0.31%).
| Demographics | Rating | Rank | Unemployment Among Women with Children Ages 6 to 17 years |
| Immigrants | Mexico | 0.7 /100 | #258 | Tragic 9.5% |
| Immigrants | Central America | 0.6 /100 | #259 | Tragic 9.5% |
| Italians | 0.6 /100 | #260 | Tragic 9.5% |
| South Americans | 0.5 /100 | #261 | Tragic 9.5% |
| Senegalese | 0.5 /100 | #262 | Tragic 9.5% |
| Lebanese | 0.5 /100 | #263 | Tragic 9.5% |
| Immigrants | Ghana | 0.4 /100 | #264 | Tragic 9.5% |
| West Indians | 0.4 /100 | #265 | Tragic 9.5% |
| Immigrants | Jamaica | 0.3 /100 | #266 | Tragic 9.5% |
| Irish | 0.3 /100 | #267 | Tragic 9.5% |
| Ghanaians | 0.2 /100 | #268 | Tragic 9.6% |
| Blackfeet | 0.2 /100 | #269 | Tragic 9.6% |
| Immigrants | Nicaragua | 0.2 /100 | #270 | Tragic 9.6% |
| Immigrants | Latin America | 0.1 /100 | #271 | Tragic 9.6% |
| Kiowa | 0.1 /100 | #272 | Tragic 9.6% |
Demographics Similar to Immigrants from Bolivia by Unemployment Among Women with Children Ages 6 to 17 years
In terms of unemployment among women with children ages 6 to 17 years, the demographic groups most similar to Immigrants from Bolivia are Cypriot (8.4%, a difference of 0.020%), Immigrants from Belarus (8.4%, a difference of 0.12%), Mongolian (8.4%, a difference of 0.16%), Pakistani (8.4%, a difference of 0.17%), and Bulgarian (8.4%, a difference of 0.19%).
| Demographics | Rating | Rank | Unemployment Among Women with Children Ages 6 to 17 years |
| Samoans | 99.7 /100 | #74 | Exceptional 8.4% |
| Immigrants | Sri Lanka | 99.7 /100 | #75 | Exceptional 8.4% |
| Immigrants | Moldova | 99.7 /100 | #76 | Exceptional 8.4% |
| Iraqis | 99.7 /100 | #77 | Exceptional 8.4% |
| Pakistanis | 99.6 /100 | #78 | Exceptional 8.4% |
| Mongolians | 99.6 /100 | #79 | Exceptional 8.4% |
| Immigrants | Belarus | 99.6 /100 | #80 | Exceptional 8.4% |
| Immigrants | Bolivia | 99.6 /100 | #81 | Exceptional 8.4% |
| Cypriots | 99.6 /100 | #82 | Exceptional 8.4% |
| Bulgarians | 99.5 /100 | #83 | Exceptional 8.4% |
| Japanese | 99.5 /100 | #84 | Exceptional 8.4% |
| Immigrants | North Macedonia | 99.4 /100 | #85 | Exceptional 8.5% |
| Alaskan Athabascans | 99.4 /100 | #86 | Exceptional 8.5% |
| Immigrants | Israel | 99.1 /100 | #87 | Exceptional 8.5% |
| Immigrants | Vietnam | 99.1 /100 | #88 | Exceptional 8.5% |