Welsh vs Immigrants from Latin America Unemployment Among Women with Children Under 6 years
COMPARE
Welsh
Immigrants from Latin America
Unemployment Among Women with Children Under 6 years
Unemployment Among Women with Children Under 6 years Comparison
Welsh
Immigrants from Latin America
8.0%
UNEMPLOYMENT AMONG WOMEN WITH CHILDREN UNDER 6 YEARS
5.0/ 100
METRIC RATING
232nd/ 347
METRIC RANK
8.6%
UNEMPLOYMENT AMONG WOMEN WITH CHILDREN UNDER 6 YEARS
0.1/ 100
METRIC RATING
275th/ 347
METRIC RANK
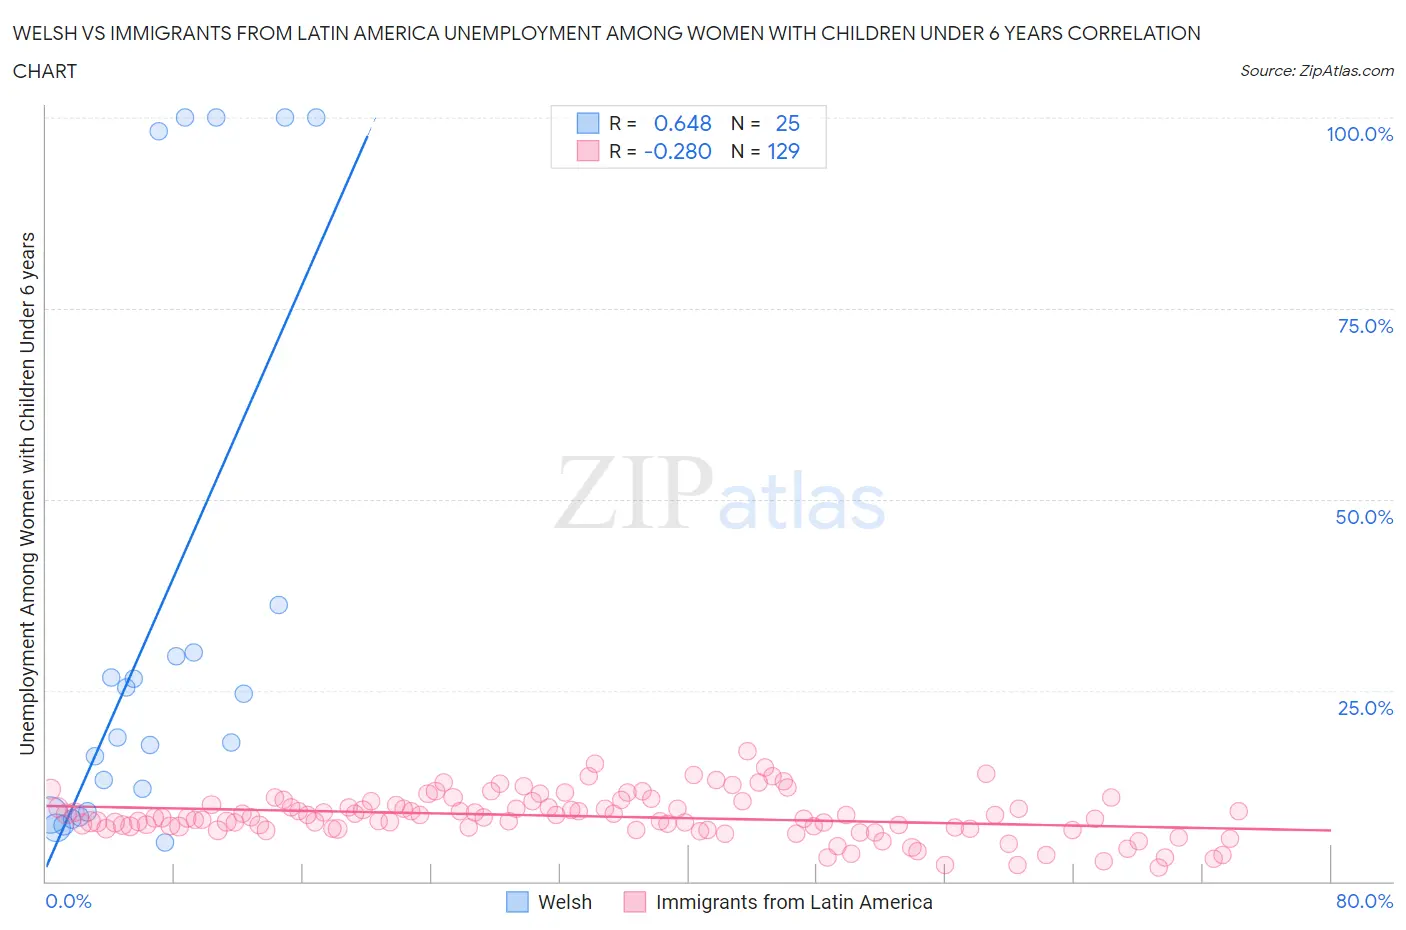
Welsh vs Immigrants from Latin America Unemployment Among Women with Children Under 6 years Correlation Chart
The statistical analysis conducted on geographies consisting of 357,262,742 people shows a significant positive correlation between the proportion of Welsh and unemployment rate among women with children under the age of 6 in the United States with a correlation coefficient (R) of 0.648 and weighted average of 8.0%. Similarly, the statistical analysis conducted on geographies consisting of 377,212,121 people shows a weak negative correlation between the proportion of Immigrants from Latin America and unemployment rate among women with children under the age of 6 in the United States with a correlation coefficient (R) of -0.280 and weighted average of 8.6%, a difference of 7.0%.
Unemployment Among Women with Children Under 6 years Correlation Summary
| Measurement | Welsh | Immigrants from Latin America |
| Minimum | 5.1% | 1.8% |
| Maximum | 100.0% | 17.0% |
| Range | 94.9% | 15.2% |
| Mean | 33.9% | 8.5% |
| Median | 18.8% | 8.3% |
| Interquartile 25% (IQ1) | 8.9% | 6.9% |
| Interquartile 75% (IQ3) | 33.0% | 10.2% |
| Interquartile Range (IQR) | 24.2% | 3.3% |
| Standard Deviation (Sample) | 34.6% | 2.9% |
| Standard Deviation (Population) | 33.9% | 2.9% |
Similar Demographics by Unemployment Among Women with Children Under 6 years
Demographics Similar to Welsh by Unemployment Among Women with Children Under 6 years
In terms of unemployment among women with children under 6 years, the demographic groups most similar to Welsh are Finnish (8.0%, a difference of 0.090%), Trinidadian and Tobagonian (8.0%, a difference of 0.090%), Immigrants from Trinidad and Tobago (8.0%, a difference of 0.090%), Salvadoran (8.0%, a difference of 0.16%), and Kiowa (8.0%, a difference of 0.23%).
| Demographics | Rating | Rank | Unemployment Among Women with Children Under 6 years |
| Germans | 7.0 /100 | #225 | Tragic 8.0% |
| Senegalese | 6.2 /100 | #226 | Tragic 8.0% |
| Portuguese | 6.2 /100 | #227 | Tragic 8.0% |
| Immigrants | Sudan | 6.0 /100 | #228 | Tragic 8.0% |
| Salvadorans | 5.5 /100 | #229 | Tragic 8.0% |
| Finns | 5.3 /100 | #230 | Tragic 8.0% |
| Trinidadians and Tobagonians | 5.3 /100 | #231 | Tragic 8.0% |
| Welsh | 5.0 /100 | #232 | Tragic 8.0% |
| Immigrants | Trinidad and Tobago | 4.8 /100 | #233 | Tragic 8.0% |
| Kiowa | 4.4 /100 | #234 | Tragic 8.0% |
| Comanche | 4.3 /100 | #235 | Tragic 8.0% |
| Immigrants | Barbados | 4.2 /100 | #236 | Tragic 8.0% |
| Immigrants | Costa Rica | 4.1 /100 | #237 | Tragic 8.0% |
| Immigrants | Middle Africa | 3.2 /100 | #238 | Tragic 8.1% |
| Irish | 2.7 /100 | #239 | Tragic 8.1% |
Demographics Similar to Immigrants from Latin America by Unemployment Among Women with Children Under 6 years
In terms of unemployment among women with children under 6 years, the demographic groups most similar to Immigrants from Latin America are Immigrants from Cameroon (8.6%, a difference of 0.050%), Yaqui (8.6%, a difference of 0.34%), Haitian (8.6%, a difference of 0.45%), Slovak (8.5%, a difference of 0.72%), and Immigrants from Dominica (8.6%, a difference of 0.73%).
| Demographics | Rating | Rank | Unemployment Among Women with Children Under 6 years |
| Sub-Saharan Africans | 0.2 /100 | #268 | Tragic 8.4% |
| Immigrants | Haiti | 0.2 /100 | #269 | Tragic 8.4% |
| Immigrants | Senegal | 0.2 /100 | #270 | Tragic 8.5% |
| Immigrants | Congo | 0.2 /100 | #271 | Tragic 8.5% |
| Mexican American Indians | 0.1 /100 | #272 | Tragic 8.5% |
| Slovaks | 0.1 /100 | #273 | Tragic 8.5% |
| Immigrants | Cameroon | 0.1 /100 | #274 | Tragic 8.6% |
| Immigrants | Latin America | 0.1 /100 | #275 | Tragic 8.6% |
| Yaqui | 0.0 /100 | #276 | Tragic 8.6% |
| Haitians | 0.0 /100 | #277 | Tragic 8.6% |
| Immigrants | Dominica | 0.0 /100 | #278 | Tragic 8.6% |
| Immigrants | Guatemala | 0.0 /100 | #279 | Tragic 8.6% |
| Immigrants | Belize | 0.0 /100 | #280 | Tragic 8.6% |
| Guatemalans | 0.0 /100 | #281 | Tragic 8.7% |
| Bermudans | 0.0 /100 | #282 | Tragic 8.7% |