Immigrants from Armenia vs Mongolian Unemployment Among Women with Children Under 6 years
COMPARE
Immigrants from Armenia
Mongolian
Unemployment Among Women with Children Under 6 years
Unemployment Among Women with Children Under 6 years Comparison
Immigrants from Armenia
Mongolians
7.4%
UNEMPLOYMENT AMONG WOMEN WITH CHILDREN UNDER 6 YEARS
87.4/ 100
METRIC RATING
132nd/ 347
METRIC RANK
6.5%
UNEMPLOYMENT AMONG WOMEN WITH CHILDREN UNDER 6 YEARS
100.0/ 100
METRIC RATING
19th/ 347
METRIC RANK
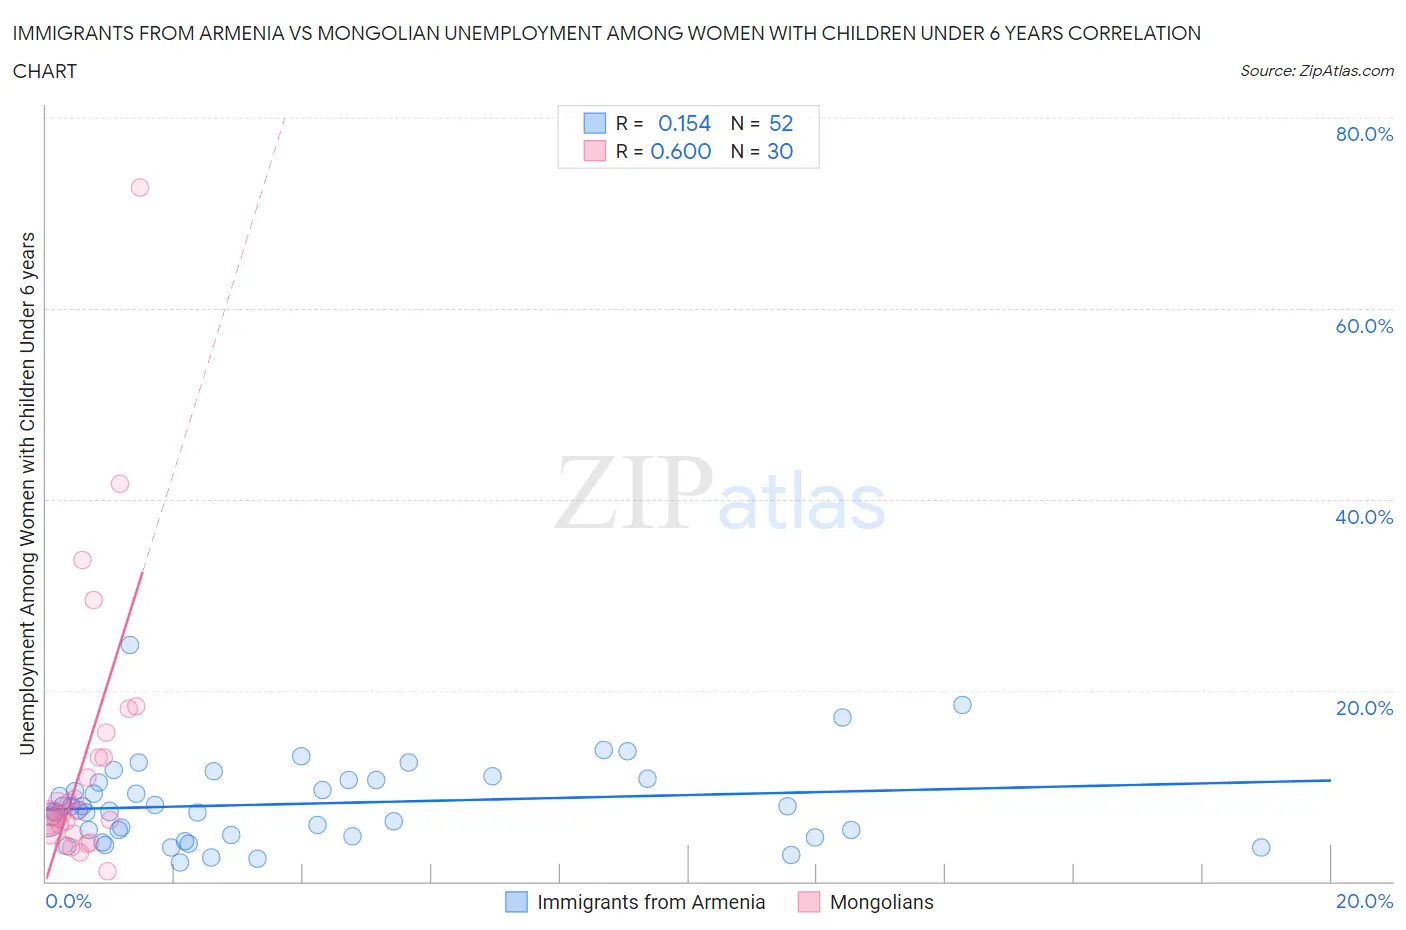
Immigrants from Armenia vs Mongolian Unemployment Among Women with Children Under 6 years Correlation Chart
The statistical analysis conducted on geographies consisting of 89,096,417 people shows a poor positive correlation between the proportion of Immigrants from Armenia and unemployment rate among women with children under the age of 6 in the United States with a correlation coefficient (R) of 0.154 and weighted average of 7.4%. Similarly, the statistical analysis conducted on geographies consisting of 125,353,250 people shows a substantial positive correlation between the proportion of Mongolians and unemployment rate among women with children under the age of 6 in the United States with a correlation coefficient (R) of 0.600 and weighted average of 6.5%, a difference of 14.3%.
Unemployment Among Women with Children Under 6 years Correlation Summary
| Measurement | Immigrants from Armenia | Mongolian |
| Minimum | 1.9% | 1.1% |
| Maximum | 24.7% | 72.7% |
| Range | 22.8% | 71.6% |
| Mean | 8.1% | 12.7% |
| Median | 7.3% | 7.2% |
| Interquartile 25% (IQ1) | 4.8% | 5.0% |
| Interquartile 75% (IQ3) | 10.6% | 13.0% |
| Interquartile Range (IQR) | 5.8% | 8.0% |
| Standard Deviation (Sample) | 4.4% | 14.7% |
| Standard Deviation (Population) | 4.4% | 14.5% |
Similar Demographics by Unemployment Among Women with Children Under 6 years
Demographics Similar to Immigrants from Armenia by Unemployment Among Women with Children Under 6 years
In terms of unemployment among women with children under 6 years, the demographic groups most similar to Immigrants from Armenia are Immigrants from Uganda (7.4%, a difference of 0.12%), Ukrainian (7.4%, a difference of 0.13%), Swedish (7.4%, a difference of 0.17%), Immigrants from Bolivia (7.4%, a difference of 0.24%), and Slovene (7.4%, a difference of 0.30%).
| Demographics | Rating | Rank | Unemployment Among Women with Children Under 6 years |
| Pakistanis | 92.2 /100 | #125 | Exceptional 7.3% |
| Immigrants | Burma/Myanmar | 91.9 /100 | #126 | Exceptional 7.3% |
| Jordanians | 91.5 /100 | #127 | Exceptional 7.3% |
| Zimbabweans | 91.5 /100 | #128 | Exceptional 7.3% |
| Slovenes | 89.2 /100 | #129 | Excellent 7.4% |
| Swedes | 88.4 /100 | #130 | Excellent 7.4% |
| Ukrainians | 88.2 /100 | #131 | Excellent 7.4% |
| Immigrants | Armenia | 87.4 /100 | #132 | Excellent 7.4% |
| Immigrants | Uganda | 86.5 /100 | #133 | Excellent 7.4% |
| Immigrants | Bolivia | 85.7 /100 | #134 | Excellent 7.4% |
| Immigrants | Northern Africa | 85.3 /100 | #135 | Excellent 7.4% |
| Immigrants | Morocco | 84.9 /100 | #136 | Excellent 7.4% |
| Immigrants | Cambodia | 84.6 /100 | #137 | Excellent 7.4% |
| Immigrants | Norway | 84.1 /100 | #138 | Excellent 7.4% |
| Immigrants | Colombia | 83.9 /100 | #139 | Excellent 7.4% |
Demographics Similar to Mongolians by Unemployment Among Women with Children Under 6 years
In terms of unemployment among women with children under 6 years, the demographic groups most similar to Mongolians are Ute (6.5%, a difference of 0.050%), Burmese (6.5%, a difference of 0.10%), Assyrian/Chaldean/Syriac (6.5%, a difference of 0.32%), Immigrants from Korea (6.5%, a difference of 0.53%), and Bulgarian (6.5%, a difference of 0.73%).
| Demographics | Rating | Rank | Unemployment Among Women with Children Under 6 years |
| Immigrants | Singapore | 100.0 /100 | #12 | Exceptional 6.3% |
| Immigrants | Eastern Asia | 100.0 /100 | #13 | Exceptional 6.3% |
| Immigrants | Bulgaria | 100.0 /100 | #14 | Exceptional 6.3% |
| Thais | 100.0 /100 | #15 | Exceptional 6.3% |
| Immigrants | Uzbekistan | 100.0 /100 | #16 | Exceptional 6.3% |
| Immigrants | Malaysia | 100.0 /100 | #17 | Exceptional 6.4% |
| Assyrians/Chaldeans/Syriacs | 100.0 /100 | #18 | Exceptional 6.5% |
| Mongolians | 100.0 /100 | #19 | Exceptional 6.5% |
| Ute | 100.0 /100 | #20 | Exceptional 6.5% |
| Burmese | 100.0 /100 | #21 | Exceptional 6.5% |
| Immigrants | Korea | 100.0 /100 | #22 | Exceptional 6.5% |
| Bulgarians | 100.0 /100 | #23 | Exceptional 6.5% |
| Laotians | 100.0 /100 | #24 | Exceptional 6.5% |
| Soviet Union | 100.0 /100 | #25 | Exceptional 6.5% |
| Cypriots | 100.0 /100 | #26 | Exceptional 6.5% |