Welsh vs Immigrants from Israel Unemployment Among Women with Children Under 6 years
COMPARE
Welsh
Immigrants from Israel
Unemployment Among Women with Children Under 6 years
Unemployment Among Women with Children Under 6 years Comparison
Welsh
Immigrants from Israel
8.0%
UNEMPLOYMENT AMONG WOMEN WITH CHILDREN UNDER 6 YEARS
5.0/ 100
METRIC RATING
232nd/ 347
METRIC RANK
6.5%
UNEMPLOYMENT AMONG WOMEN WITH CHILDREN UNDER 6 YEARS
100.0/ 100
METRIC RATING
28th/ 347
METRIC RANK
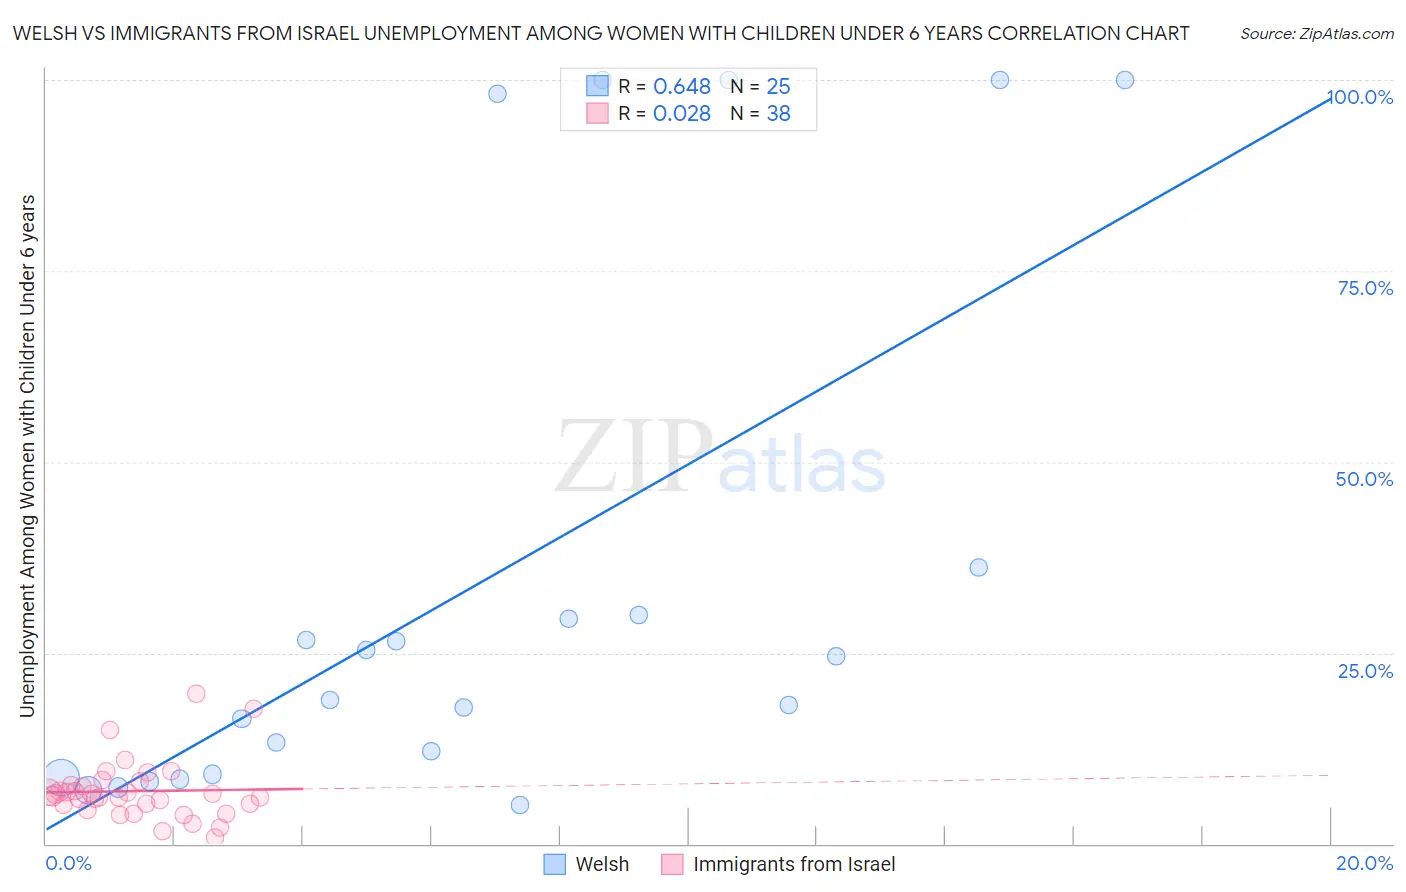
Welsh vs Immigrants from Israel Unemployment Among Women with Children Under 6 years Correlation Chart
The statistical analysis conducted on geographies consisting of 357,262,742 people shows a significant positive correlation between the proportion of Welsh and unemployment rate among women with children under the age of 6 in the United States with a correlation coefficient (R) of 0.648 and weighted average of 8.0%. Similarly, the statistical analysis conducted on geographies consisting of 175,300,948 people shows no correlation between the proportion of Immigrants from Israel and unemployment rate among women with children under the age of 6 in the United States with a correlation coefficient (R) of 0.028 and weighted average of 6.5%, a difference of 22.5%.
Unemployment Among Women with Children Under 6 years Correlation Summary
| Measurement | Welsh | Immigrants from Israel |
| Minimum | 5.1% | 0.90% |
| Maximum | 100.0% | 19.6% |
| Range | 94.9% | 18.7% |
| Mean | 33.9% | 6.9% |
| Median | 18.8% | 6.4% |
| Interquartile 25% (IQ1) | 8.9% | 5.0% |
| Interquartile 75% (IQ3) | 33.0% | 7.7% |
| Interquartile Range (IQR) | 24.2% | 2.6% |
| Standard Deviation (Sample) | 34.6% | 3.8% |
| Standard Deviation (Population) | 33.9% | 3.8% |
Similar Demographics by Unemployment Among Women with Children Under 6 years
Demographics Similar to Welsh by Unemployment Among Women with Children Under 6 years
In terms of unemployment among women with children under 6 years, the demographic groups most similar to Welsh are Finnish (8.0%, a difference of 0.090%), Trinidadian and Tobagonian (8.0%, a difference of 0.090%), Immigrants from Trinidad and Tobago (8.0%, a difference of 0.090%), Salvadoran (8.0%, a difference of 0.16%), and Kiowa (8.0%, a difference of 0.23%).
| Demographics | Rating | Rank | Unemployment Among Women with Children Under 6 years |
| Germans | 7.0 /100 | #225 | Tragic 8.0% |
| Senegalese | 6.2 /100 | #226 | Tragic 8.0% |
| Portuguese | 6.2 /100 | #227 | Tragic 8.0% |
| Immigrants | Sudan | 6.0 /100 | #228 | Tragic 8.0% |
| Salvadorans | 5.5 /100 | #229 | Tragic 8.0% |
| Finns | 5.3 /100 | #230 | Tragic 8.0% |
| Trinidadians and Tobagonians | 5.3 /100 | #231 | Tragic 8.0% |
| Welsh | 5.0 /100 | #232 | Tragic 8.0% |
| Immigrants | Trinidad and Tobago | 4.8 /100 | #233 | Tragic 8.0% |
| Kiowa | 4.4 /100 | #234 | Tragic 8.0% |
| Comanche | 4.3 /100 | #235 | Tragic 8.0% |
| Immigrants | Barbados | 4.2 /100 | #236 | Tragic 8.0% |
| Immigrants | Costa Rica | 4.1 /100 | #237 | Tragic 8.0% |
| Immigrants | Middle Africa | 3.2 /100 | #238 | Tragic 8.1% |
| Irish | 2.7 /100 | #239 | Tragic 8.1% |
Demographics Similar to Immigrants from Israel by Unemployment Among Women with Children Under 6 years
In terms of unemployment among women with children under 6 years, the demographic groups most similar to Immigrants from Israel are Immigrants from Japan (6.5%, a difference of 0.020%), Cypriot (6.5%, a difference of 0.12%), Soviet Union (6.5%, a difference of 0.20%), Laotian (6.5%, a difference of 0.22%), and Immigrants from Sweden (6.6%, a difference of 0.26%).
| Demographics | Rating | Rank | Unemployment Among Women with Children Under 6 years |
| Burmese | 100.0 /100 | #21 | Exceptional 6.5% |
| Immigrants | Korea | 100.0 /100 | #22 | Exceptional 6.5% |
| Bulgarians | 100.0 /100 | #23 | Exceptional 6.5% |
| Laotians | 100.0 /100 | #24 | Exceptional 6.5% |
| Soviet Union | 100.0 /100 | #25 | Exceptional 6.5% |
| Cypriots | 100.0 /100 | #26 | Exceptional 6.5% |
| Immigrants | Japan | 100.0 /100 | #27 | Exceptional 6.5% |
| Immigrants | Israel | 100.0 /100 | #28 | Exceptional 6.5% |
| Immigrants | Sweden | 100.0 /100 | #29 | Exceptional 6.6% |
| Immigrants | Belarus | 100.0 /100 | #30 | Exceptional 6.6% |
| Immigrants | Moldova | 100.0 /100 | #31 | Exceptional 6.6% |
| Tsimshian | 100.0 /100 | #32 | Exceptional 6.6% |
| Immigrants | Vietnam | 100.0 /100 | #33 | Exceptional 6.6% |
| Immigrants | South Central Asia | 100.0 /100 | #34 | Exceptional 6.6% |
| Yakama | 100.0 /100 | #35 | Exceptional 6.6% |