Immigrants from Europe vs Kenyan Male Unemployment
COMPARE
Immigrants from Europe
Kenyan
Male Unemployment
Male Unemployment Comparison
Immigrants from Europe
Kenyans
5.2%
MALE UNEMPLOYMENT
76.2/ 100
METRIC RATING
149th/ 347
METRIC RANK
5.2%
MALE UNEMPLOYMENT
79.4/ 100
METRIC RATING
139th/ 347
METRIC RANK
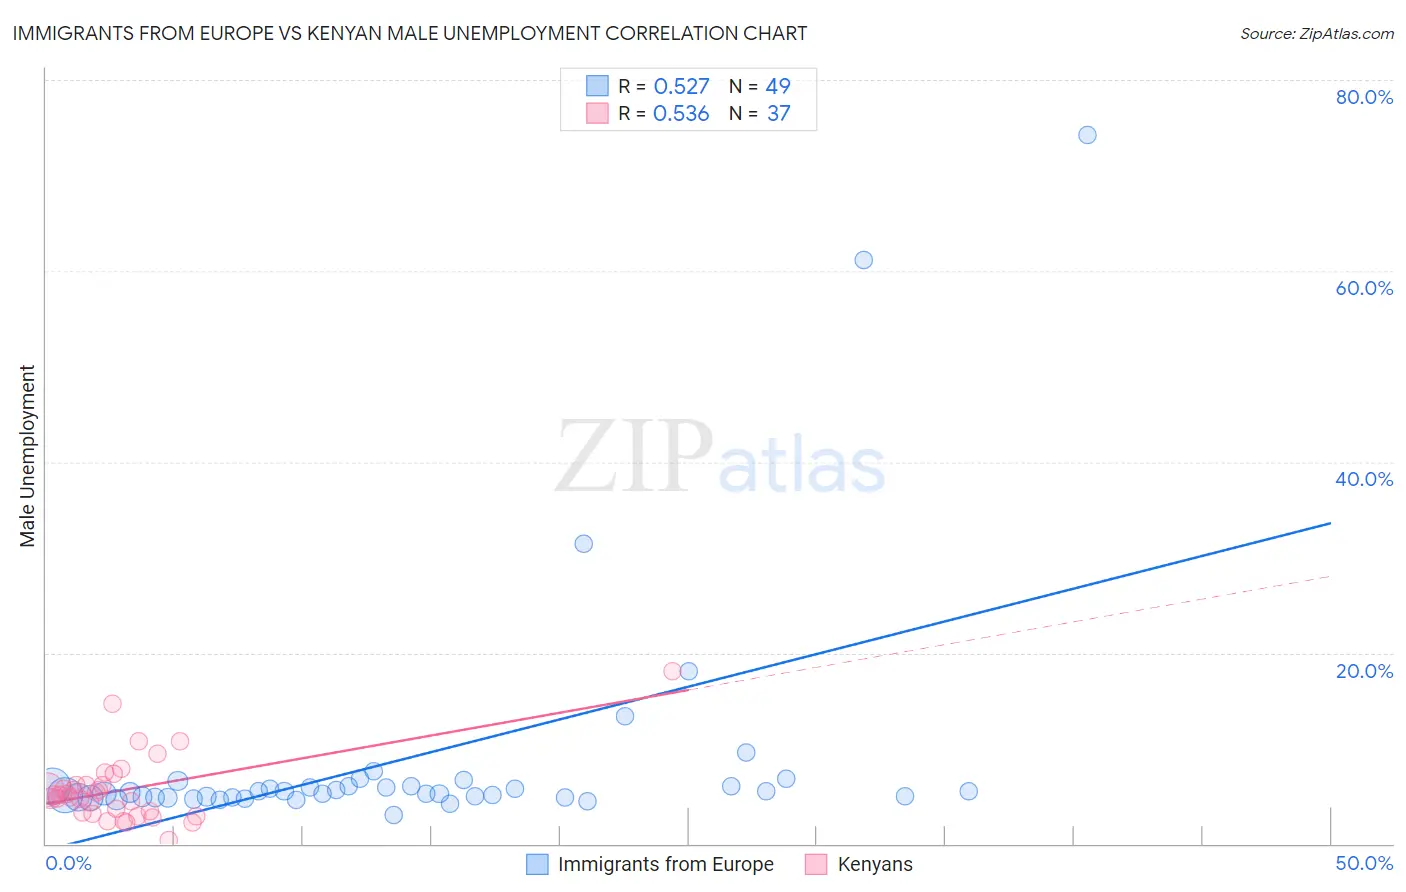
Immigrants from Europe vs Kenyan Male Unemployment Correlation Chart
The statistical analysis conducted on geographies consisting of 540,308,967 people shows a substantial positive correlation between the proportion of Immigrants from Europe and unemployment rate among males in the United States with a correlation coefficient (R) of 0.527 and weighted average of 5.2%. Similarly, the statistical analysis conducted on geographies consisting of 168,001,564 people shows a substantial positive correlation between the proportion of Kenyans and unemployment rate among males in the United States with a correlation coefficient (R) of 0.536 and weighted average of 5.2%, a difference of 0.28%.
Male Unemployment Correlation Summary
| Measurement | Immigrants from Europe | Kenyan |
| Minimum | 3.1% | 0.40% |
| Maximum | 74.2% | 18.1% |
| Range | 71.1% | 17.7% |
| Mean | 8.9% | 5.6% |
| Median | 5.3% | 5.1% |
| Interquartile 25% (IQ1) | 4.8% | 3.2% |
| Interquartile 75% (IQ3) | 6.0% | 6.2% |
| Interquartile Range (IQR) | 1.2% | 3.0% |
| Standard Deviation (Sample) | 13.0% | 3.5% |
| Standard Deviation (Population) | 12.9% | 3.5% |
Demographics Similar to Immigrants from Europe and Kenyans by Male Unemployment
In terms of male unemployment, the demographic groups most similar to Immigrants from Europe are Immigrants from Italy (5.2%, a difference of 0.010%), Indian (Asian) (5.2%, a difference of 0.020%), Slovak (5.2%, a difference of 0.060%), Immigrants from Burma/Myanmar (5.2%, a difference of 0.11%), and Egyptian (5.2%, a difference of 0.11%). Similarly, the demographic groups most similar to Kenyans are Brazilian (5.2%, a difference of 0.010%), Immigrants from Croatia (5.2%, a difference of 0.020%), Immigrants from Switzerland (5.2%, a difference of 0.020%), Immigrants from Eastern Africa (5.2%, a difference of 0.030%), and Lebanese (5.2%, a difference of 0.040%).
| Demographics | Rating | Rank | Male Unemployment |
| Pakistanis | 80.5 /100 | #134 | Excellent 5.2% |
| Immigrants | Saudi Arabia | 80.1 /100 | #135 | Excellent 5.2% |
| Lebanese | 79.9 /100 | #136 | Good 5.2% |
| Immigrants | Eastern Africa | 79.8 /100 | #137 | Good 5.2% |
| Immigrants | Croatia | 79.7 /100 | #138 | Good 5.2% |
| Kenyans | 79.4 /100 | #139 | Good 5.2% |
| Brazilians | 79.3 /100 | #140 | Good 5.2% |
| Immigrants | Switzerland | 79.2 /100 | #141 | Good 5.2% |
| Fijians | 78.3 /100 | #142 | Good 5.2% |
| Syrians | 78.0 /100 | #143 | Good 5.2% |
| Sri Lankans | 77.9 /100 | #144 | Good 5.2% |
| Macedonians | 77.7 /100 | #145 | Good 5.2% |
| Immigrants | Kenya | 77.6 /100 | #146 | Good 5.2% |
| Immigrants | Burma/Myanmar | 77.5 /100 | #147 | Good 5.2% |
| Immigrants | Italy | 76.3 /100 | #148 | Good 5.2% |
| Immigrants | Europe | 76.2 /100 | #149 | Good 5.2% |
| Indians (Asian) | 76.0 /100 | #150 | Good 5.2% |
| Slovaks | 75.5 /100 | #151 | Good 5.2% |
| Egyptians | 74.8 /100 | #152 | Good 5.2% |
| Immigrants | Uruguay | 73.9 /100 | #153 | Good 5.2% |
| Laotians | 73.8 /100 | #154 | Good 5.2% |