Immigrants from Croatia vs Immigrants from Thailand Female Unemployment
COMPARE
Immigrants from Croatia
Immigrants from Thailand
Female Unemployment
Female Unemployment Comparison
Immigrants from Croatia
Immigrants from Thailand
5.1%
FEMALE UNEMPLOYMENT
89.9/ 100
METRIC RATING
118th/ 347
METRIC RANK
5.2%
FEMALE UNEMPLOYMENT
62.1/ 100
METRIC RATING
167th/ 347
METRIC RANK
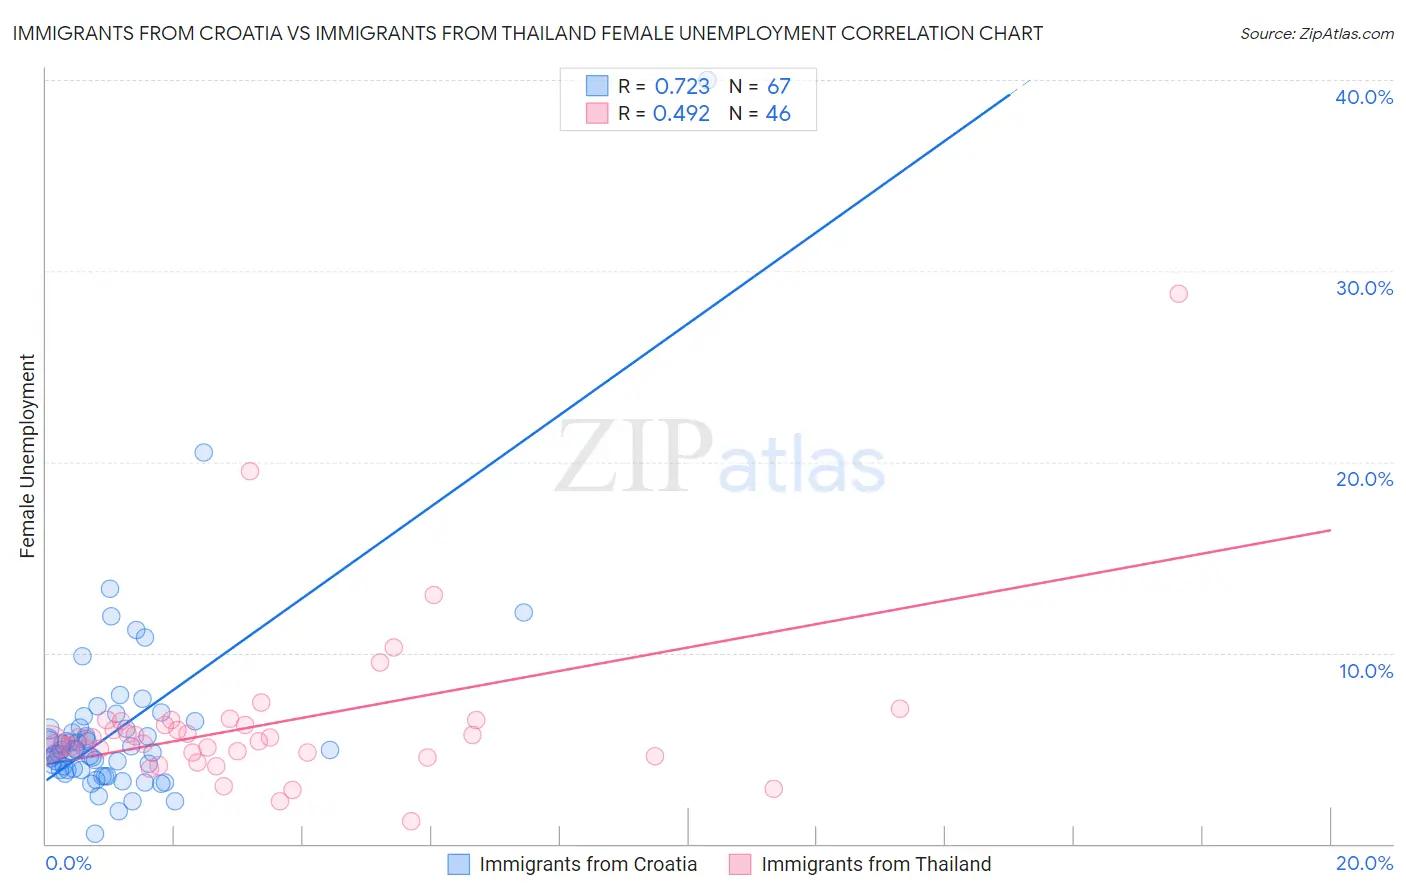
Immigrants from Croatia vs Immigrants from Thailand Female Unemployment Correlation Chart
The statistical analysis conducted on geographies consisting of 132,440,567 people shows a strong positive correlation between the proportion of Immigrants from Croatia and unemploymnet rate among females in the United States with a correlation coefficient (R) of 0.723 and weighted average of 5.1%. Similarly, the statistical analysis conducted on geographies consisting of 316,285,605 people shows a moderate positive correlation between the proportion of Immigrants from Thailand and unemploymnet rate among females in the United States with a correlation coefficient (R) of 0.492 and weighted average of 5.2%, a difference of 2.6%.
Female Unemployment Correlation Summary
| Measurement | Immigrants from Croatia | Immigrants from Thailand |
| Minimum | 0.50% | 1.2% |
| Maximum | 40.0% | 28.8% |
| Range | 39.5% | 27.6% |
| Mean | 6.0% | 6.3% |
| Median | 4.9% | 5.5% |
| Interquartile 25% (IQ1) | 3.9% | 4.8% |
| Interquartile 75% (IQ3) | 6.0% | 6.4% |
| Interquartile Range (IQR) | 2.1% | 1.7% |
| Standard Deviation (Sample) | 5.2% | 4.4% |
| Standard Deviation (Population) | 5.2% | 4.4% |
Similar Demographics by Female Unemployment
Demographics Similar to Immigrants from Croatia by Female Unemployment
In terms of female unemployment, the demographic groups most similar to Immigrants from Croatia are Jordanian (5.1%, a difference of 0.060%), American (5.1%, a difference of 0.11%), Lebanese (5.1%, a difference of 0.18%), Immigrants from Turkey (5.1%, a difference of 0.20%), and Immigrants from Saudi Arabia (5.1%, a difference of 0.24%).
| Demographics | Rating | Rank | Female Unemployment |
| Immigrants | Burma/Myanmar | 92.3 /100 | #111 | Exceptional 5.1% |
| Estonians | 92.1 /100 | #112 | Exceptional 5.1% |
| Immigrants | Saudi Arabia | 91.2 /100 | #113 | Exceptional 5.1% |
| Immigrants | Turkey | 91.0 /100 | #114 | Exceptional 5.1% |
| Lebanese | 91.0 /100 | #115 | Exceptional 5.1% |
| Americans | 90.5 /100 | #116 | Exceptional 5.1% |
| Jordanians | 90.3 /100 | #117 | Exceptional 5.1% |
| Immigrants | Croatia | 89.9 /100 | #118 | Excellent 5.1% |
| Immigrants | North Macedonia | 88.3 /100 | #119 | Excellent 5.1% |
| Immigrants | Romania | 88.1 /100 | #120 | Excellent 5.1% |
| Immigrants | Western Europe | 88.1 /100 | #121 | Excellent 5.1% |
| Immigrants | Germany | 87.6 /100 | #122 | Excellent 5.1% |
| Immigrants | South Africa | 87.6 /100 | #123 | Excellent 5.1% |
| Immigrants | Europe | 87.2 /100 | #124 | Excellent 5.1% |
| Basques | 86.5 /100 | #125 | Excellent 5.1% |
Demographics Similar to Immigrants from Thailand by Female Unemployment
In terms of female unemployment, the demographic groups most similar to Immigrants from Thailand are Syrian (5.2%, a difference of 0.040%), Native Hawaiian (5.2%, a difference of 0.040%), Immigrants from Asia (5.2%, a difference of 0.14%), Bangladeshi (5.2%, a difference of 0.14%), and Sri Lankan (5.2%, a difference of 0.17%).
| Demographics | Rating | Rank | Female Unemployment |
| Immigrants | Spain | 66.8 /100 | #160 | Good 5.2% |
| Immigrants | Pakistan | 66.7 /100 | #161 | Good 5.2% |
| Potawatomi | 65.9 /100 | #162 | Good 5.2% |
| Immigrants | Asia | 64.3 /100 | #163 | Good 5.2% |
| Bangladeshis | 64.3 /100 | #164 | Good 5.2% |
| Syrians | 62.8 /100 | #165 | Good 5.2% |
| Native Hawaiians | 62.7 /100 | #166 | Good 5.2% |
| Immigrants | Thailand | 62.1 /100 | #167 | Good 5.2% |
| Sri Lankans | 59.4 /100 | #168 | Average 5.2% |
| Immigrants | Chile | 59.0 /100 | #169 | Average 5.2% |
| Spanish | 55.9 /100 | #170 | Average 5.2% |
| Immigrants | Denmark | 55.0 /100 | #171 | Average 5.2% |
| Immigrants | Uganda | 50.7 /100 | #172 | Average 5.3% |
| Iranians | 50.4 /100 | #173 | Average 5.3% |
| Immigrants | Poland | 50.0 /100 | #174 | Average 5.3% |