Immigrants from Honduras vs Immigrants from Thailand Female Unemployment
COMPARE
Immigrants from Honduras
Immigrants from Thailand
Female Unemployment
Female Unemployment Comparison
Immigrants from Honduras
Immigrants from Thailand
5.9%
FEMALE UNEMPLOYMENT
0.0/ 100
METRIC RATING
270th/ 347
METRIC RANK
5.2%
FEMALE UNEMPLOYMENT
62.1/ 100
METRIC RATING
167th/ 347
METRIC RANK
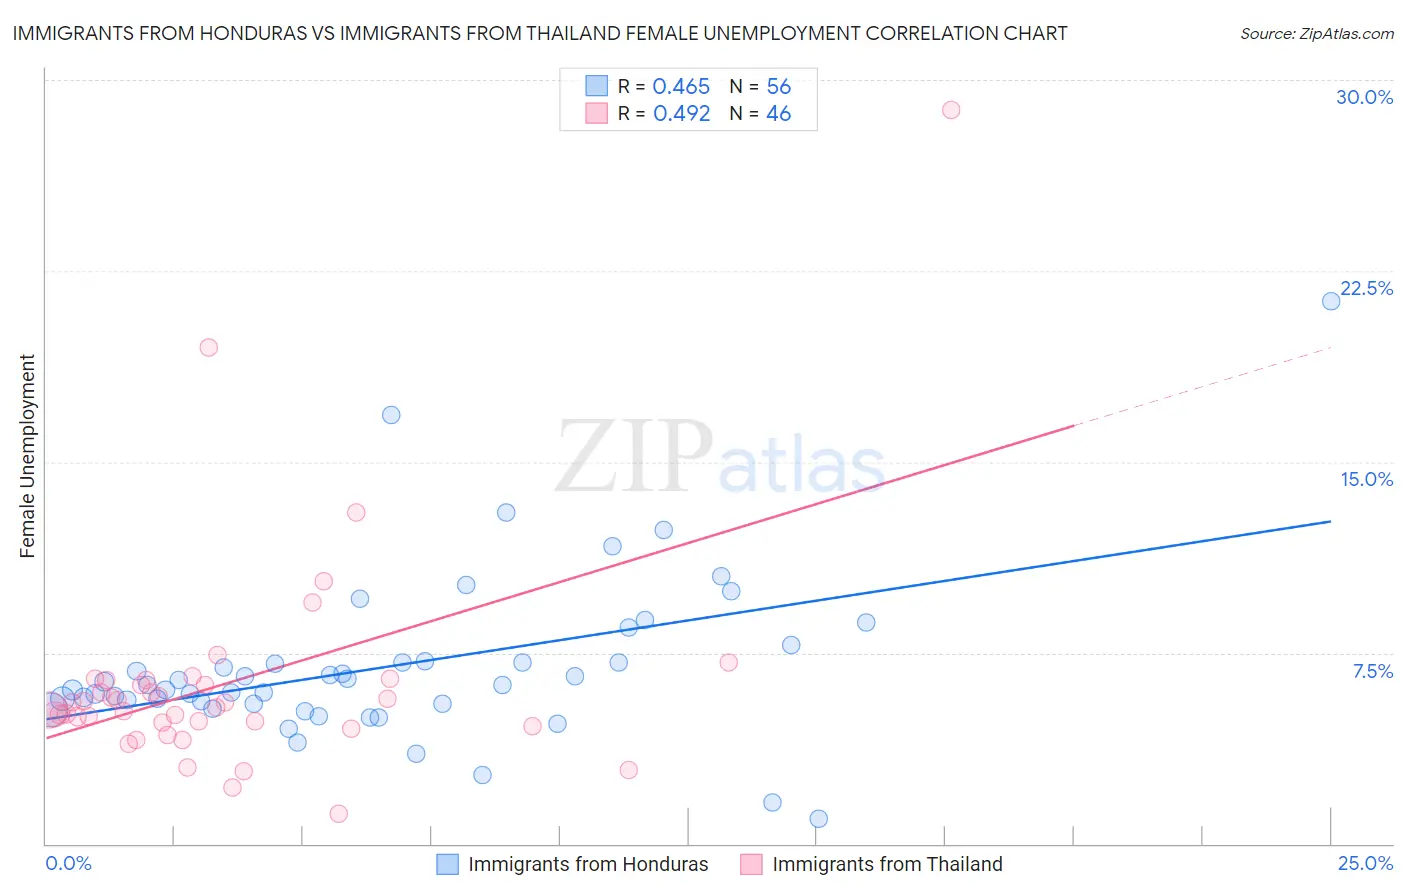
Immigrants from Honduras vs Immigrants from Thailand Female Unemployment Correlation Chart
The statistical analysis conducted on geographies consisting of 321,601,293 people shows a moderate positive correlation between the proportion of Immigrants from Honduras and unemploymnet rate among females in the United States with a correlation coefficient (R) of 0.465 and weighted average of 5.9%. Similarly, the statistical analysis conducted on geographies consisting of 316,285,605 people shows a moderate positive correlation between the proportion of Immigrants from Thailand and unemploymnet rate among females in the United States with a correlation coefficient (R) of 0.492 and weighted average of 5.2%, a difference of 13.6%.
Female Unemployment Correlation Summary
| Measurement | Immigrants from Honduras | Immigrants from Thailand |
| Minimum | 1.0% | 1.2% |
| Maximum | 21.3% | 28.8% |
| Range | 20.3% | 27.6% |
| Mean | 7.0% | 6.3% |
| Median | 6.3% | 5.5% |
| Interquartile 25% (IQ1) | 5.5% | 4.8% |
| Interquartile 75% (IQ3) | 7.1% | 6.4% |
| Interquartile Range (IQR) | 1.6% | 1.7% |
| Standard Deviation (Sample) | 3.3% | 4.4% |
| Standard Deviation (Population) | 3.3% | 4.4% |
Similar Demographics by Female Unemployment
Demographics Similar to Immigrants from Honduras by Female Unemployment
In terms of female unemployment, the demographic groups most similar to Immigrants from Honduras are Central American (5.9%, a difference of 0.10%), Lumbee (5.9%, a difference of 0.29%), Ghanaian (5.9%, a difference of 0.30%), African (5.9%, a difference of 0.38%), and Immigrants from Western Africa (5.9%, a difference of 0.41%).
| Demographics | Rating | Rank | Female Unemployment |
| Immigrants | Azores | 0.1 /100 | #263 | Tragic 5.8% |
| Immigrants | Bahamas | 0.1 /100 | #264 | Tragic 5.8% |
| Blackfeet | 0.0 /100 | #265 | Tragic 5.9% |
| Cape Verdeans | 0.0 /100 | #266 | Tragic 5.9% |
| Nepalese | 0.0 /100 | #267 | Tragic 5.9% |
| Hondurans | 0.0 /100 | #268 | Tragic 5.9% |
| Immigrants | Western Africa | 0.0 /100 | #269 | Tragic 5.9% |
| Immigrants | Honduras | 0.0 /100 | #270 | Tragic 5.9% |
| Central Americans | 0.0 /100 | #271 | Tragic 5.9% |
| Lumbee | 0.0 /100 | #272 | Tragic 5.9% |
| Ghanaians | 0.0 /100 | #273 | Tragic 5.9% |
| Africans | 0.0 /100 | #274 | Tragic 5.9% |
| Senegalese | 0.0 /100 | #275 | Tragic 6.0% |
| Bahamians | 0.0 /100 | #276 | Tragic 6.0% |
| Immigrants | Ghana | 0.0 /100 | #277 | Tragic 6.0% |
Demographics Similar to Immigrants from Thailand by Female Unemployment
In terms of female unemployment, the demographic groups most similar to Immigrants from Thailand are Syrian (5.2%, a difference of 0.040%), Native Hawaiian (5.2%, a difference of 0.040%), Immigrants from Asia (5.2%, a difference of 0.14%), Bangladeshi (5.2%, a difference of 0.14%), and Sri Lankan (5.2%, a difference of 0.17%).
| Demographics | Rating | Rank | Female Unemployment |
| Immigrants | Spain | 66.8 /100 | #160 | Good 5.2% |
| Immigrants | Pakistan | 66.7 /100 | #161 | Good 5.2% |
| Potawatomi | 65.9 /100 | #162 | Good 5.2% |
| Immigrants | Asia | 64.3 /100 | #163 | Good 5.2% |
| Bangladeshis | 64.3 /100 | #164 | Good 5.2% |
| Syrians | 62.8 /100 | #165 | Good 5.2% |
| Native Hawaiians | 62.7 /100 | #166 | Good 5.2% |
| Immigrants | Thailand | 62.1 /100 | #167 | Good 5.2% |
| Sri Lankans | 59.4 /100 | #168 | Average 5.2% |
| Immigrants | Chile | 59.0 /100 | #169 | Average 5.2% |
| Spanish | 55.9 /100 | #170 | Average 5.2% |
| Immigrants | Denmark | 55.0 /100 | #171 | Average 5.2% |
| Immigrants | Uganda | 50.7 /100 | #172 | Average 5.3% |
| Iranians | 50.4 /100 | #173 | Average 5.3% |
| Immigrants | Poland | 50.0 /100 | #174 | Average 5.3% |