Immigrants from Saudi Arabia vs Immigrants from Korea Male Unemployment
COMPARE
Immigrants from Saudi Arabia
Immigrants from Korea
Male Unemployment
Male Unemployment Comparison
Immigrants from Saudi Arabia
Immigrants from Korea
5.2%
MALE UNEMPLOYMENT
80.1/ 100
METRIC RATING
135th/ 347
METRIC RANK
4.9%
MALE UNEMPLOYMENT
99.1/ 100
METRIC RATING
44th/ 347
METRIC RANK
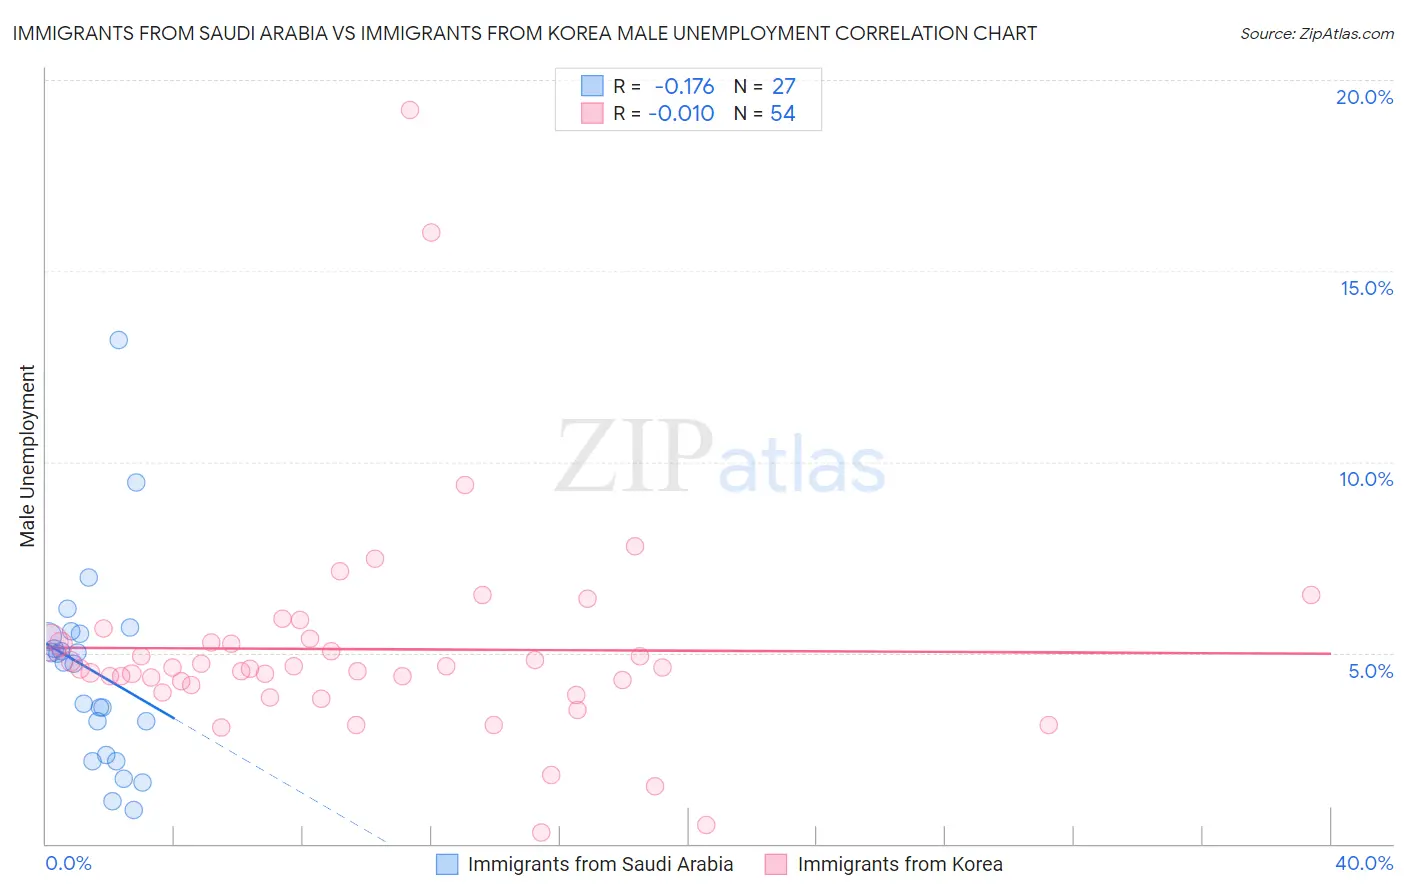
Immigrants from Saudi Arabia vs Immigrants from Korea Male Unemployment Correlation Chart
The statistical analysis conducted on geographies consisting of 164,168,129 people shows a poor negative correlation between the proportion of Immigrants from Saudi Arabia and unemployment rate among males in the United States with a correlation coefficient (R) of -0.176 and weighted average of 5.2%. Similarly, the statistical analysis conducted on geographies consisting of 414,464,791 people shows no correlation between the proportion of Immigrants from Korea and unemployment rate among males in the United States with a correlation coefficient (R) of -0.010 and weighted average of 4.9%, a difference of 5.2%.
Male Unemployment Correlation Summary
| Measurement | Immigrants from Saudi Arabia | Immigrants from Korea |
| Minimum | 0.90% | 0.30% |
| Maximum | 13.2% | 19.2% |
| Range | 12.3% | 18.9% |
| Mean | 4.5% | 5.1% |
| Median | 4.8% | 4.6% |
| Interquartile 25% (IQ1) | 2.3% | 4.2% |
| Interquartile 75% (IQ3) | 5.5% | 5.3% |
| Interquartile Range (IQR) | 3.2% | 1.1% |
| Standard Deviation (Sample) | 2.6% | 3.0% |
| Standard Deviation (Population) | 2.6% | 2.9% |
Similar Demographics by Male Unemployment
Demographics Similar to Immigrants from Saudi Arabia by Male Unemployment
In terms of male unemployment, the demographic groups most similar to Immigrants from Saudi Arabia are Lebanese (5.2%, a difference of 0.020%), Pakistani (5.2%, a difference of 0.030%), Immigrants from Eastern Africa (5.2%, a difference of 0.030%), Immigrants from Croatia (5.2%, a difference of 0.040%), and Kenyan (5.2%, a difference of 0.060%).
| Demographics | Rating | Rank | Male Unemployment |
| Hungarians | 85.1 /100 | #128 | Excellent 5.2% |
| Immigrants | Western Europe | 84.8 /100 | #129 | Excellent 5.2% |
| Immigrants | Malaysia | 83.5 /100 | #130 | Excellent 5.2% |
| Immigrants | Germany | 83.0 /100 | #131 | Excellent 5.2% |
| Chickasaw | 82.9 /100 | #132 | Excellent 5.2% |
| Colombians | 81.1 /100 | #133 | Excellent 5.2% |
| Pakistanis | 80.5 /100 | #134 | Excellent 5.2% |
| Immigrants | Saudi Arabia | 80.1 /100 | #135 | Excellent 5.2% |
| Lebanese | 79.9 /100 | #136 | Good 5.2% |
| Immigrants | Eastern Africa | 79.8 /100 | #137 | Good 5.2% |
| Immigrants | Croatia | 79.7 /100 | #138 | Good 5.2% |
| Kenyans | 79.4 /100 | #139 | Good 5.2% |
| Brazilians | 79.3 /100 | #140 | Good 5.2% |
| Immigrants | Switzerland | 79.2 /100 | #141 | Good 5.2% |
| Fijians | 78.3 /100 | #142 | Good 5.2% |
Demographics Similar to Immigrants from Korea by Male Unemployment
In terms of male unemployment, the demographic groups most similar to Immigrants from Korea are Immigrants from Zimbabwe (4.9%, a difference of 0.15%), Immigrants from Japan (4.9%, a difference of 0.18%), Bhutanese (4.9%, a difference of 0.24%), Immigrants from Belgium (4.9%, a difference of 0.29%), and Chinese (4.9%, a difference of 0.31%).
| Demographics | Rating | Rank | Male Unemployment |
| Scotch-Irish | 99.4 /100 | #37 | Exceptional 4.9% |
| Immigrants | Bosnia and Herzegovina | 99.4 /100 | #38 | Exceptional 4.9% |
| Burmese | 99.3 /100 | #39 | Exceptional 4.9% |
| Northern Europeans | 99.3 /100 | #40 | Exceptional 4.9% |
| Chinese | 99.3 /100 | #41 | Exceptional 4.9% |
| Immigrants | Belgium | 99.2 /100 | #42 | Exceptional 4.9% |
| Immigrants | Japan | 99.2 /100 | #43 | Exceptional 4.9% |
| Immigrants | Korea | 99.1 /100 | #44 | Exceptional 4.9% |
| Immigrants | Zimbabwe | 99.0 /100 | #45 | Exceptional 4.9% |
| Bhutanese | 98.9 /100 | #46 | Exceptional 4.9% |
| Austrians | 98.9 /100 | #47 | Exceptional 4.9% |
| Immigrants | Scotland | 98.9 /100 | #48 | Exceptional 4.9% |
| Poles | 98.9 /100 | #49 | Exceptional 4.9% |
| Croatians | 98.9 /100 | #50 | Exceptional 4.9% |
| Slovenes | 98.8 /100 | #51 | Exceptional 5.0% |