Venezuelan vs Immigrants from Panama Unemployment Among Women with Children Under 6 years
COMPARE
Venezuelan
Immigrants from Panama
Unemployment Among Women with Children Under 6 years
Unemployment Among Women with Children Under 6 years Comparison
Venezuelans
Immigrants from Panama
7.2%
UNEMPLOYMENT AMONG WOMEN WITH CHILDREN UNDER 6 YEARS
97.2/ 100
METRIC RATING
105th/ 347
METRIC RANK
7.7%
UNEMPLOYMENT AMONG WOMEN WITH CHILDREN UNDER 6 YEARS
35.7/ 100
METRIC RATING
189th/ 347
METRIC RANK
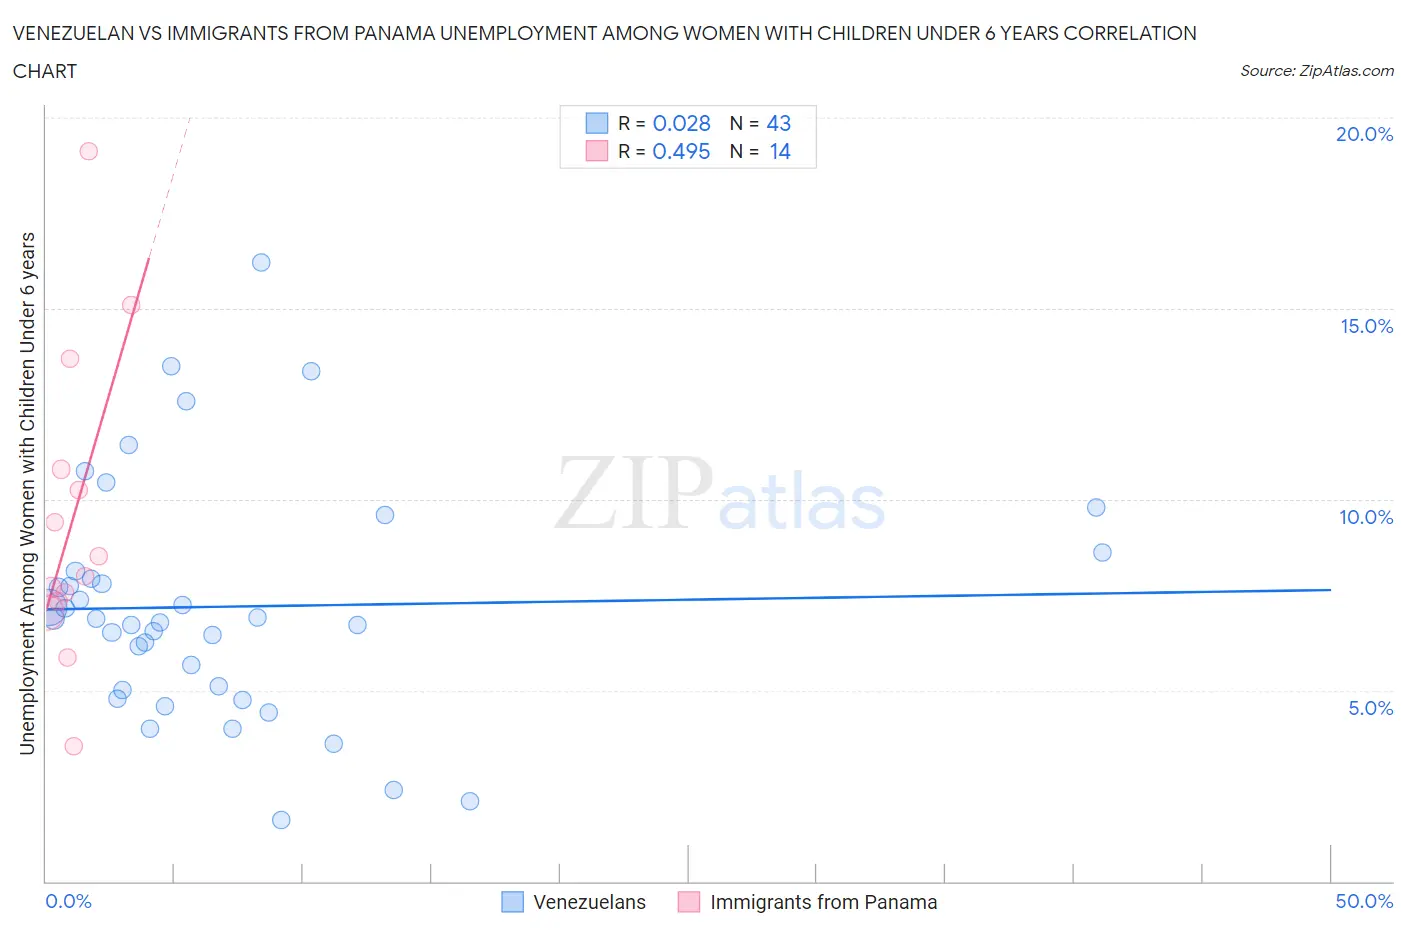
Venezuelan vs Immigrants from Panama Unemployment Among Women with Children Under 6 years Correlation Chart
The statistical analysis conducted on geographies consisting of 246,662,940 people shows no correlation between the proportion of Venezuelans and unemployment rate among women with children under the age of 6 in the United States with a correlation coefficient (R) of 0.028 and weighted average of 7.2%. Similarly, the statistical analysis conducted on geographies consisting of 188,916,649 people shows a moderate positive correlation between the proportion of Immigrants from Panama and unemployment rate among women with children under the age of 6 in the United States with a correlation coefficient (R) of 0.495 and weighted average of 7.7%, a difference of 7.3%.
Unemployment Among Women with Children Under 6 years Correlation Summary
| Measurement | Venezuelan | Immigrants from Panama |
| Minimum | 1.6% | 3.5% |
| Maximum | 16.2% | 19.1% |
| Range | 14.6% | 15.6% |
| Mean | 7.2% | 9.6% |
| Median | 6.9% | 8.2% |
| Interquartile 25% (IQ1) | 5.0% | 7.3% |
| Interquartile 75% (IQ3) | 8.1% | 10.8% |
| Interquartile Range (IQR) | 3.1% | 3.4% |
| Standard Deviation (Sample) | 3.1% | 4.0% |
| Standard Deviation (Population) | 3.1% | 3.9% |
Similar Demographics by Unemployment Among Women with Children Under 6 years
Demographics Similar to Venezuelans by Unemployment Among Women with Children Under 6 years
In terms of unemployment among women with children under 6 years, the demographic groups most similar to Venezuelans are Immigrants from Egypt (7.2%, a difference of 0.010%), Immigrants from Pakistan (7.2%, a difference of 0.010%), Immigrants from Kazakhstan (7.2%, a difference of 0.030%), Immigrants from Nicaragua (7.2%, a difference of 0.090%), and Immigrants from Saudi Arabia (7.2%, a difference of 0.090%).
| Demographics | Rating | Rank | Unemployment Among Women with Children Under 6 years |
| Russians | 97.5 /100 | #98 | Exceptional 7.2% |
| Immigrants | Europe | 97.5 /100 | #99 | Exceptional 7.2% |
| Immigrants | Northern Europe | 97.4 /100 | #100 | Exceptional 7.2% |
| Chileans | 97.4 /100 | #101 | Exceptional 7.2% |
| Immigrants | Nicaragua | 97.3 /100 | #102 | Exceptional 7.2% |
| Immigrants | Saudi Arabia | 97.3 /100 | #103 | Exceptional 7.2% |
| Immigrants | Egypt | 97.2 /100 | #104 | Exceptional 7.2% |
| Venezuelans | 97.2 /100 | #105 | Exceptional 7.2% |
| Immigrants | Pakistan | 97.2 /100 | #106 | Exceptional 7.2% |
| Immigrants | Kazakhstan | 97.1 /100 | #107 | Exceptional 7.2% |
| Eastern Europeans | 96.9 /100 | #108 | Exceptional 7.2% |
| Australians | 96.9 /100 | #109 | Exceptional 7.2% |
| Palestinians | 96.8 /100 | #110 | Exceptional 7.2% |
| Norwegians | 96.7 /100 | #111 | Exceptional 7.2% |
| Israelis | 96.5 /100 | #112 | Exceptional 7.2% |
Demographics Similar to Immigrants from Panama by Unemployment Among Women with Children Under 6 years
In terms of unemployment among women with children under 6 years, the demographic groups most similar to Immigrants from Panama are Immigrants from North Macedonia (7.7%, a difference of 0.090%), Immigrants from Thailand (7.7%, a difference of 0.20%), Czechoslovakian (7.7%, a difference of 0.20%), Immigrants from Austria (7.7%, a difference of 0.24%), and Immigrants from Africa (7.7%, a difference of 0.24%).
| Demographics | Rating | Rank | Unemployment Among Women with Children Under 6 years |
| Nepalese | 43.5 /100 | #182 | Average 7.7% |
| Sierra Leoneans | 42.9 /100 | #183 | Average 7.7% |
| Indonesians | 40.5 /100 | #184 | Average 7.7% |
| Spanish Americans | 39.7 /100 | #185 | Fair 7.7% |
| Yugoslavians | 39.4 /100 | #186 | Fair 7.7% |
| Immigrants | Thailand | 38.5 /100 | #187 | Fair 7.7% |
| Czechoslovakians | 38.4 /100 | #188 | Fair 7.7% |
| Immigrants | Panama | 35.7 /100 | #189 | Fair 7.7% |
| Immigrants | North Macedonia | 34.4 /100 | #190 | Fair 7.7% |
| Immigrants | Austria | 32.4 /100 | #191 | Fair 7.7% |
| Immigrants | Africa | 32.4 /100 | #192 | Fair 7.7% |
| Slavs | 32.4 /100 | #193 | Fair 7.7% |
| Syrians | 31.9 /100 | #194 | Fair 7.7% |
| Malaysians | 31.1 /100 | #195 | Fair 7.7% |
| Immigrants | St. Vincent and the Grenadines | 31.1 /100 | #196 | Fair 7.7% |