Venezuelan vs Puerto Rican Unemployment Among Women with Children Under 6 years
COMPARE
Venezuelan
Puerto Rican
Unemployment Among Women with Children Under 6 years
Unemployment Among Women with Children Under 6 years Comparison
Venezuelans
Puerto Ricans
7.2%
UNEMPLOYMENT AMONG WOMEN WITH CHILDREN UNDER 6 YEARS
97.2/ 100
METRIC RATING
105th/ 347
METRIC RANK
12.5%
UNEMPLOYMENT AMONG WOMEN WITH CHILDREN UNDER 6 YEARS
0.0/ 100
METRIC RATING
335th/ 347
METRIC RANK
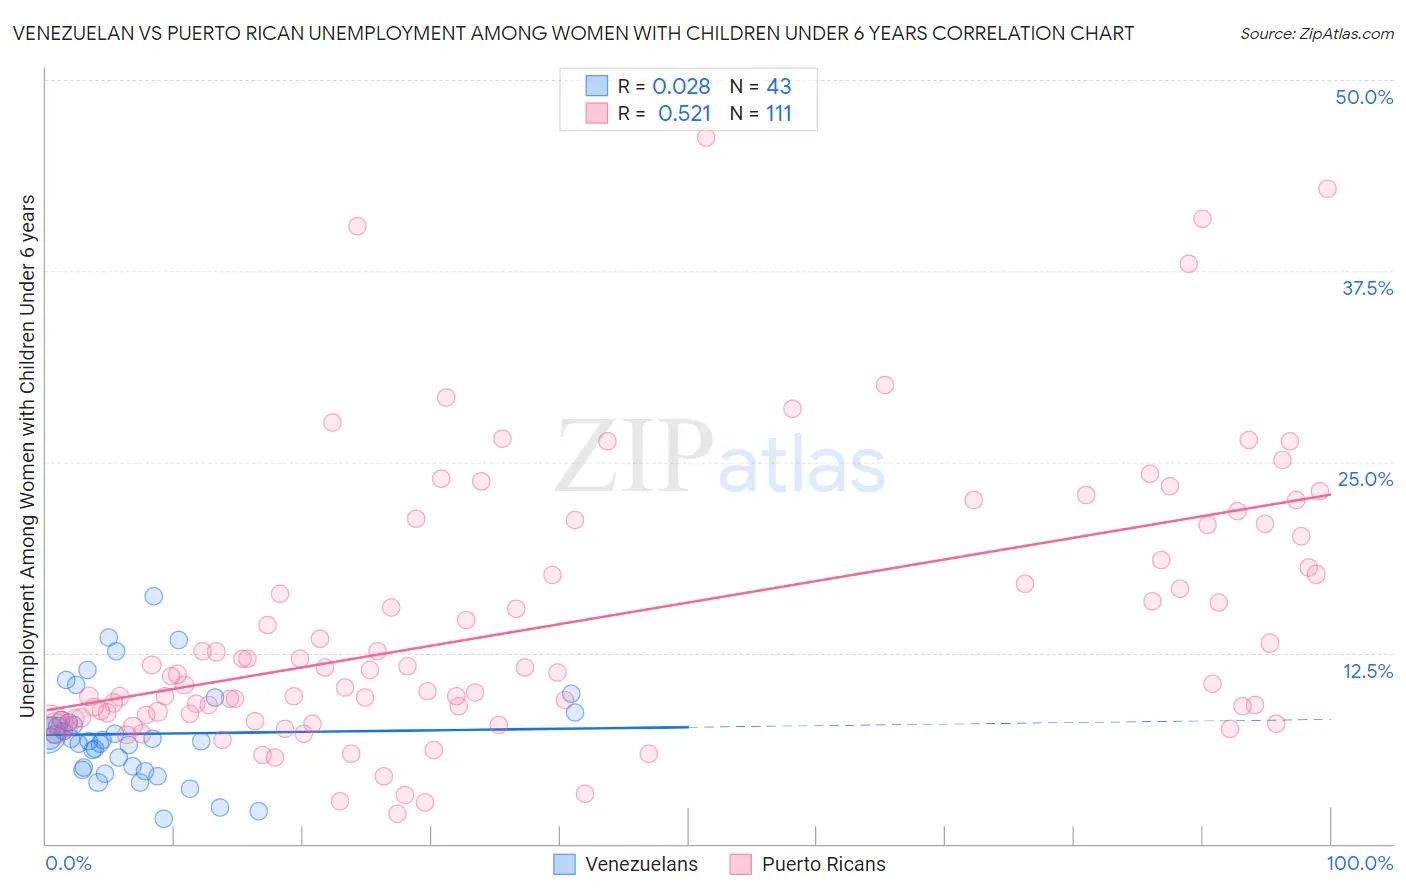
Venezuelan vs Puerto Rican Unemployment Among Women with Children Under 6 years Correlation Chart
The statistical analysis conducted on geographies consisting of 246,662,940 people shows no correlation between the proportion of Venezuelans and unemployment rate among women with children under the age of 6 in the United States with a correlation coefficient (R) of 0.028 and weighted average of 7.2%. Similarly, the statistical analysis conducted on geographies consisting of 369,552,119 people shows a substantial positive correlation between the proportion of Puerto Ricans and unemployment rate among women with children under the age of 6 in the United States with a correlation coefficient (R) of 0.521 and weighted average of 12.5%, a difference of 74.3%.
Unemployment Among Women with Children Under 6 years Correlation Summary
| Measurement | Venezuelan | Puerto Rican |
| Minimum | 1.6% | 2.0% |
| Maximum | 16.2% | 46.2% |
| Range | 14.6% | 44.2% |
| Mean | 7.2% | 14.4% |
| Median | 6.9% | 11.1% |
| Interquartile 25% (IQ1) | 5.0% | 8.3% |
| Interquartile 75% (IQ3) | 8.1% | 20.1% |
| Interquartile Range (IQR) | 3.1% | 11.9% |
| Standard Deviation (Sample) | 3.1% | 9.0% |
| Standard Deviation (Population) | 3.1% | 9.0% |
Similar Demographics by Unemployment Among Women with Children Under 6 years
Demographics Similar to Venezuelans by Unemployment Among Women with Children Under 6 years
In terms of unemployment among women with children under 6 years, the demographic groups most similar to Venezuelans are Immigrants from Egypt (7.2%, a difference of 0.010%), Immigrants from Pakistan (7.2%, a difference of 0.010%), Immigrants from Kazakhstan (7.2%, a difference of 0.030%), Immigrants from Nicaragua (7.2%, a difference of 0.090%), and Immigrants from Saudi Arabia (7.2%, a difference of 0.090%).
| Demographics | Rating | Rank | Unemployment Among Women with Children Under 6 years |
| Russians | 97.5 /100 | #98 | Exceptional 7.2% |
| Immigrants | Europe | 97.5 /100 | #99 | Exceptional 7.2% |
| Immigrants | Northern Europe | 97.4 /100 | #100 | Exceptional 7.2% |
| Chileans | 97.4 /100 | #101 | Exceptional 7.2% |
| Immigrants | Nicaragua | 97.3 /100 | #102 | Exceptional 7.2% |
| Immigrants | Saudi Arabia | 97.3 /100 | #103 | Exceptional 7.2% |
| Immigrants | Egypt | 97.2 /100 | #104 | Exceptional 7.2% |
| Venezuelans | 97.2 /100 | #105 | Exceptional 7.2% |
| Immigrants | Pakistan | 97.2 /100 | #106 | Exceptional 7.2% |
| Immigrants | Kazakhstan | 97.1 /100 | #107 | Exceptional 7.2% |
| Eastern Europeans | 96.9 /100 | #108 | Exceptional 7.2% |
| Australians | 96.9 /100 | #109 | Exceptional 7.2% |
| Palestinians | 96.8 /100 | #110 | Exceptional 7.2% |
| Norwegians | 96.7 /100 | #111 | Exceptional 7.2% |
| Israelis | 96.5 /100 | #112 | Exceptional 7.2% |
Demographics Similar to Puerto Ricans by Unemployment Among Women with Children Under 6 years
In terms of unemployment among women with children under 6 years, the demographic groups most similar to Puerto Ricans are Apache (12.3%, a difference of 1.8%), Shoshone (13.2%, a difference of 5.1%), Chippewa (13.3%, a difference of 6.3%), Pima (13.4%, a difference of 7.1%), and Navajo (13.5%, a difference of 7.5%).
| Demographics | Rating | Rank | Unemployment Among Women with Children Under 6 years |
| Tohono O'odham | 0.0 /100 | #328 | Tragic 10.2% |
| Blacks/African Americans | 0.0 /100 | #329 | Tragic 10.3% |
| Pennsylvania Germans | 0.0 /100 | #330 | Tragic 10.8% |
| Colville | 0.0 /100 | #331 | Tragic 11.2% |
| Sioux | 0.0 /100 | #332 | Tragic 11.5% |
| Natives/Alaskans | 0.0 /100 | #333 | Tragic 11.5% |
| Apache | 0.0 /100 | #334 | Tragic 12.3% |
| Puerto Ricans | 0.0 /100 | #335 | Tragic 12.5% |
| Shoshone | 0.0 /100 | #336 | Tragic 13.2% |
| Chippewa | 0.0 /100 | #337 | Tragic 13.3% |
| Pima | 0.0 /100 | #338 | Tragic 13.4% |
| Navajo | 0.0 /100 | #339 | Tragic 13.5% |
| Immigrants | Yemen | 0.0 /100 | #340 | Tragic 13.5% |
| Lumbee | 0.0 /100 | #341 | Tragic 13.8% |
| Yuman | 0.0 /100 | #342 | Tragic 14.6% |