Venezuelan vs Polish Male Unemployment
COMPARE
Venezuelan
Polish
Male Unemployment
Male Unemployment Comparison
Venezuelans
Poles
4.5%
MALE UNEMPLOYMENT
100.0/ 100
METRIC RATING
6th/ 347
METRIC RANK
4.9%
MALE UNEMPLOYMENT
98.9/ 100
METRIC RATING
49th/ 347
METRIC RANK
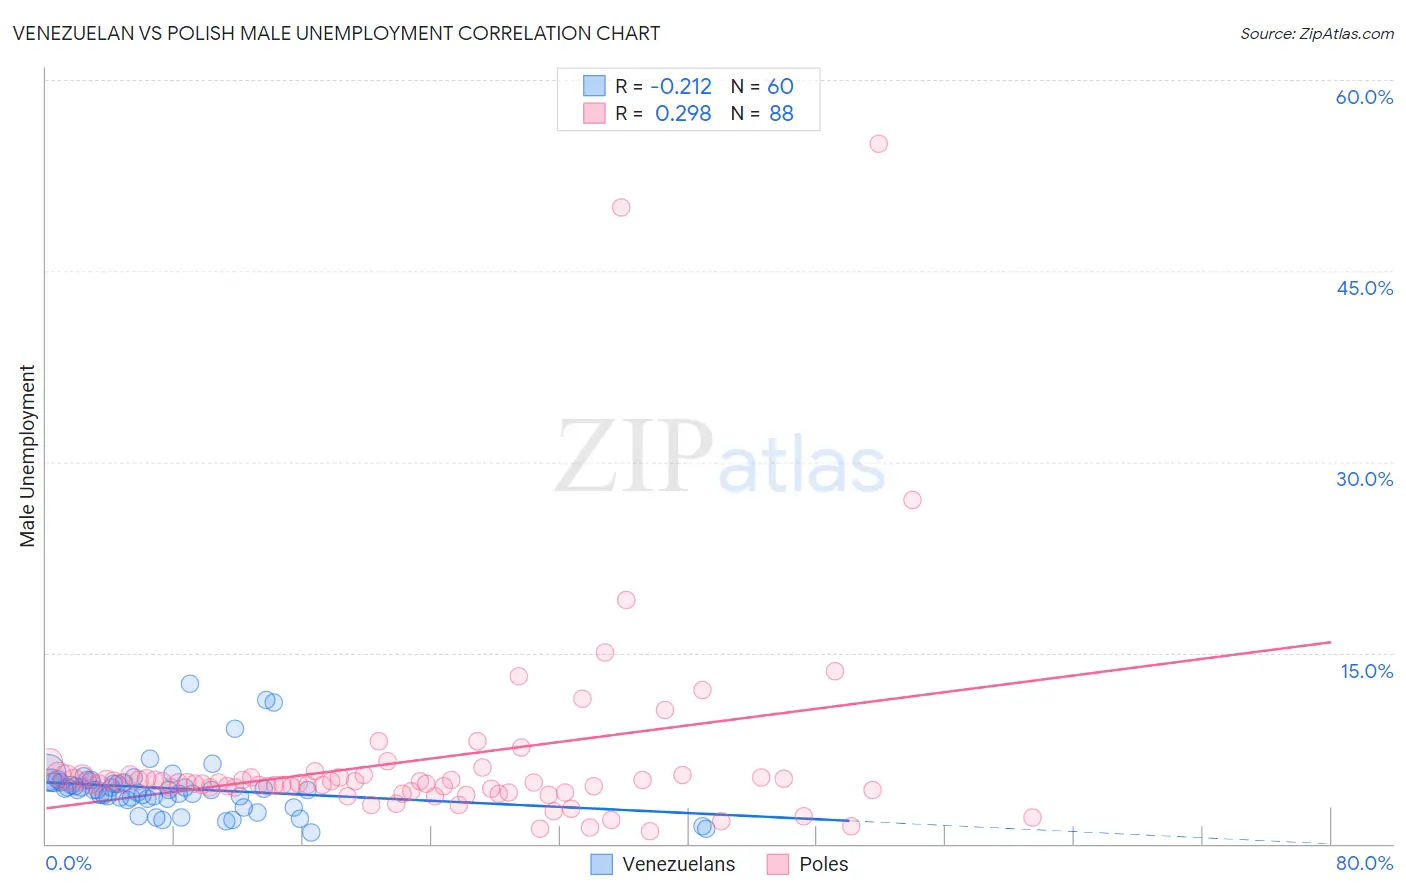
Venezuelan vs Polish Male Unemployment Correlation Chart
The statistical analysis conducted on geographies consisting of 305,681,073 people shows a weak negative correlation between the proportion of Venezuelans and unemployment rate among males in the United States with a correlation coefficient (R) of -0.212 and weighted average of 4.5%. Similarly, the statistical analysis conducted on geographies consisting of 550,894,735 people shows a weak positive correlation between the proportion of Poles and unemployment rate among males in the United States with a correlation coefficient (R) of 0.298 and weighted average of 4.9%, a difference of 9.6%.
Male Unemployment Correlation Summary
| Measurement | Venezuelan | Polish |
| Minimum | 0.90% | 1.0% |
| Maximum | 12.6% | 55.0% |
| Range | 11.7% | 54.0% |
| Mean | 4.3% | 6.5% |
| Median | 4.2% | 4.8% |
| Interquartile 25% (IQ1) | 3.5% | 4.1% |
| Interquartile 75% (IQ3) | 4.8% | 5.3% |
| Interquartile Range (IQR) | 1.3% | 1.1% |
| Standard Deviation (Sample) | 2.2% | 8.0% |
| Standard Deviation (Population) | 2.2% | 7.9% |
Similar Demographics by Male Unemployment
Demographics Similar to Venezuelans by Male Unemployment
In terms of male unemployment, the demographic groups most similar to Venezuelans are Czech (4.5%, a difference of 0.20%), Danish (4.5%, a difference of 0.45%), Luxembourger (4.5%, a difference of 0.46%), Immigrants from Venezuela (4.4%, a difference of 1.5%), and Thai (4.6%, a difference of 1.7%).
| Demographics | Rating | Rank | Male Unemployment |
| Immigrants | India | 100.0 /100 | #1 | Exceptional 4.4% |
| Immigrants | Cuba | 100.0 /100 | #2 | Exceptional 4.4% |
| Norwegians | 100.0 /100 | #3 | Exceptional 4.4% |
| Immigrants | Venezuela | 100.0 /100 | #4 | Exceptional 4.4% |
| Danes | 100.0 /100 | #5 | Exceptional 4.5% |
| Venezuelans | 100.0 /100 | #6 | Exceptional 4.5% |
| Czechs | 100.0 /100 | #7 | Exceptional 4.5% |
| Luxembourgers | 100.0 /100 | #8 | Exceptional 4.5% |
| Thais | 100.0 /100 | #9 | Exceptional 4.6% |
| Cubans | 100.0 /100 | #10 | Exceptional 4.6% |
| Swedes | 100.0 /100 | #11 | Exceptional 4.6% |
| Immigrants | Bolivia | 100.0 /100 | #12 | Exceptional 4.7% |
| Bolivians | 100.0 /100 | #13 | Exceptional 4.7% |
| Germans | 100.0 /100 | #14 | Exceptional 4.7% |
| Scandinavians | 100.0 /100 | #15 | Exceptional 4.7% |
Demographics Similar to Poles by Male Unemployment
In terms of male unemployment, the demographic groups most similar to Poles are Immigrants from Scotland (4.9%, a difference of 0.010%), Croatian (4.9%, a difference of 0.010%), Austrian (4.9%, a difference of 0.030%), Slovene (5.0%, a difference of 0.040%), and Irish (5.0%, a difference of 0.060%).
| Demographics | Rating | Rank | Male Unemployment |
| Immigrants | Belgium | 99.2 /100 | #42 | Exceptional 4.9% |
| Immigrants | Japan | 99.2 /100 | #43 | Exceptional 4.9% |
| Immigrants | Korea | 99.1 /100 | #44 | Exceptional 4.9% |
| Immigrants | Zimbabwe | 99.0 /100 | #45 | Exceptional 4.9% |
| Bhutanese | 98.9 /100 | #46 | Exceptional 4.9% |
| Austrians | 98.9 /100 | #47 | Exceptional 4.9% |
| Immigrants | Scotland | 98.9 /100 | #48 | Exceptional 4.9% |
| Poles | 98.9 /100 | #49 | Exceptional 4.9% |
| Croatians | 98.9 /100 | #50 | Exceptional 4.9% |
| Slovenes | 98.8 /100 | #51 | Exceptional 5.0% |
| Irish | 98.8 /100 | #52 | Exceptional 5.0% |
| Jordanians | 98.8 /100 | #53 | Exceptional 5.0% |
| Yugoslavians | 98.7 /100 | #54 | Exceptional 5.0% |
| Czechoslovakians | 98.7 /100 | #55 | Exceptional 5.0% |
| Immigrants | Bulgaria | 98.7 /100 | #56 | Exceptional 5.0% |