Venezuelan vs Guatemalan Male Unemployment
COMPARE
Venezuelan
Guatemalan
Male Unemployment
Male Unemployment Comparison
Venezuelans
Guatemalans
4.5%
MALE UNEMPLOYMENT
100.0/ 100
METRIC RATING
6th/ 347
METRIC RANK
5.6%
MALE UNEMPLOYMENT
1.2/ 100
METRIC RATING
236th/ 347
METRIC RANK
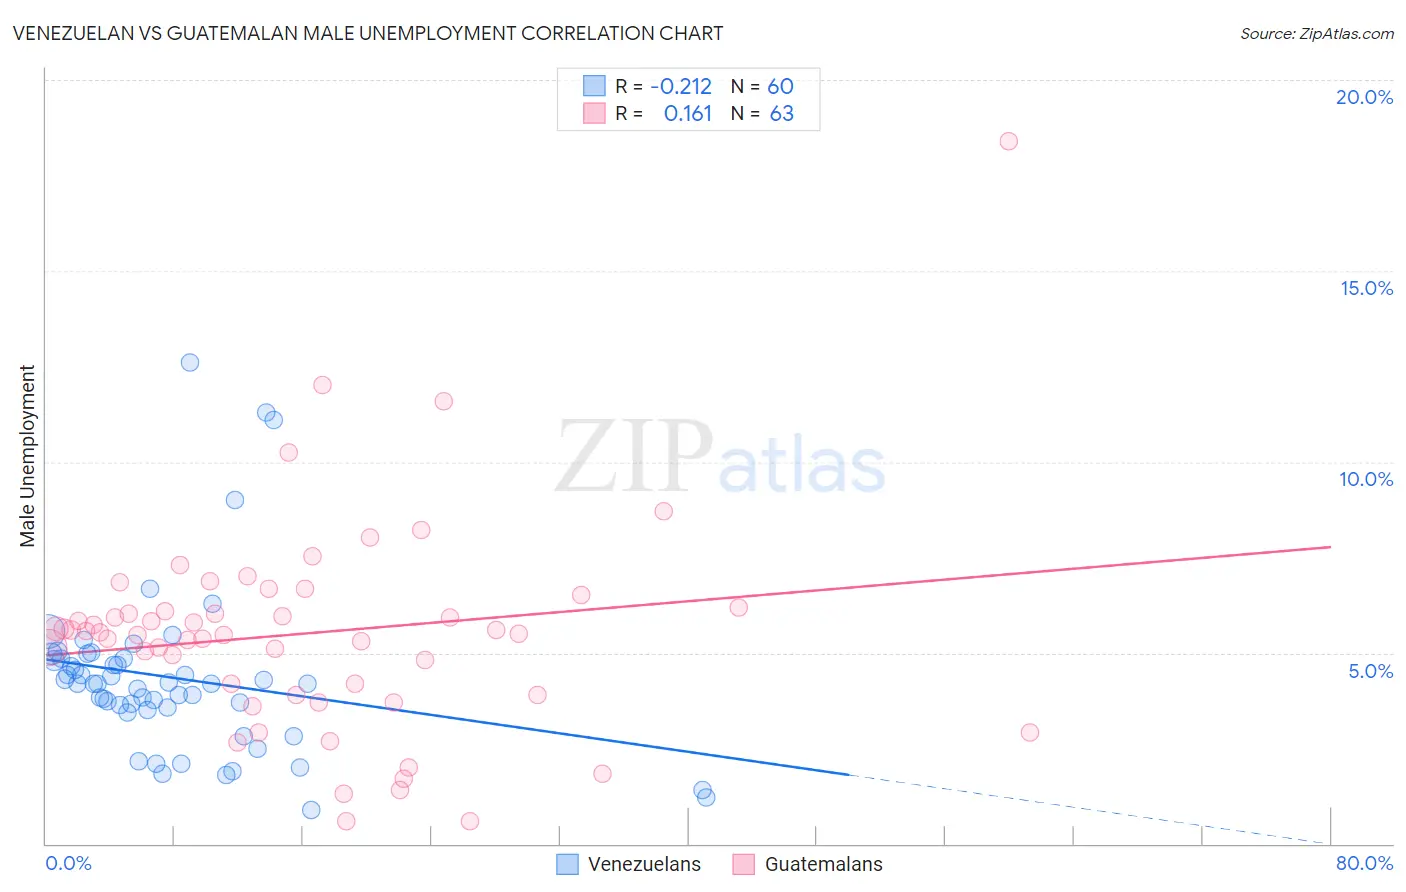
Venezuelan vs Guatemalan Male Unemployment Correlation Chart
The statistical analysis conducted on geographies consisting of 305,681,073 people shows a weak negative correlation between the proportion of Venezuelans and unemployment rate among males in the United States with a correlation coefficient (R) of -0.212 and weighted average of 4.5%. Similarly, the statistical analysis conducted on geographies consisting of 407,851,547 people shows a poor positive correlation between the proportion of Guatemalans and unemployment rate among males in the United States with a correlation coefficient (R) of 0.161 and weighted average of 5.6%, a difference of 24.8%.
Male Unemployment Correlation Summary
| Measurement | Venezuelan | Guatemalan |
| Minimum | 0.90% | 0.60% |
| Maximum | 12.6% | 18.4% |
| Range | 11.7% | 17.8% |
| Mean | 4.3% | 5.5% |
| Median | 4.2% | 5.5% |
| Interquartile 25% (IQ1) | 3.5% | 3.9% |
| Interquartile 75% (IQ3) | 4.8% | 6.2% |
| Interquartile Range (IQR) | 1.3% | 2.3% |
| Standard Deviation (Sample) | 2.2% | 2.8% |
| Standard Deviation (Population) | 2.2% | 2.8% |
Similar Demographics by Male Unemployment
Demographics Similar to Venezuelans by Male Unemployment
In terms of male unemployment, the demographic groups most similar to Venezuelans are Czech (4.5%, a difference of 0.20%), Danish (4.5%, a difference of 0.45%), Luxembourger (4.5%, a difference of 0.46%), Immigrants from Venezuela (4.4%, a difference of 1.5%), and Thai (4.6%, a difference of 1.7%).
| Demographics | Rating | Rank | Male Unemployment |
| Immigrants | India | 100.0 /100 | #1 | Exceptional 4.4% |
| Immigrants | Cuba | 100.0 /100 | #2 | Exceptional 4.4% |
| Norwegians | 100.0 /100 | #3 | Exceptional 4.4% |
| Immigrants | Venezuela | 100.0 /100 | #4 | Exceptional 4.4% |
| Danes | 100.0 /100 | #5 | Exceptional 4.5% |
| Venezuelans | 100.0 /100 | #6 | Exceptional 4.5% |
| Czechs | 100.0 /100 | #7 | Exceptional 4.5% |
| Luxembourgers | 100.0 /100 | #8 | Exceptional 4.5% |
| Thais | 100.0 /100 | #9 | Exceptional 4.6% |
| Cubans | 100.0 /100 | #10 | Exceptional 4.6% |
| Swedes | 100.0 /100 | #11 | Exceptional 4.6% |
| Immigrants | Bolivia | 100.0 /100 | #12 | Exceptional 4.7% |
| Bolivians | 100.0 /100 | #13 | Exceptional 4.7% |
| Germans | 100.0 /100 | #14 | Exceptional 4.7% |
| Scandinavians | 100.0 /100 | #15 | Exceptional 4.7% |
Demographics Similar to Guatemalans by Male Unemployment
In terms of male unemployment, the demographic groups most similar to Guatemalans are Honduran (5.6%, a difference of 0.090%), Native Hawaiian (5.6%, a difference of 0.14%), Immigrants from Guatemala (5.6%, a difference of 0.14%), Immigrants from Cameroon (5.6%, a difference of 0.21%), and Salvadoran (5.7%, a difference of 0.25%).
| Demographics | Rating | Rank | Male Unemployment |
| Central Americans | 1.8 /100 | #229 | Tragic 5.6% |
| Immigrants | Africa | 1.7 /100 | #230 | Tragic 5.6% |
| Choctaw | 1.6 /100 | #231 | Tragic 5.6% |
| Moroccans | 1.6 /100 | #232 | Tragic 5.6% |
| Somalis | 1.5 /100 | #233 | Tragic 5.6% |
| Immigrants | Somalia | 1.5 /100 | #234 | Tragic 5.6% |
| Immigrants | Honduras | 1.5 /100 | #235 | Tragic 5.6% |
| Guatemalans | 1.2 /100 | #236 | Tragic 5.6% |
| Hondurans | 1.1 /100 | #237 | Tragic 5.6% |
| Native Hawaiians | 1.1 /100 | #238 | Tragic 5.6% |
| Immigrants | Guatemala | 1.1 /100 | #239 | Tragic 5.6% |
| Immigrants | Cameroon | 1.0 /100 | #240 | Tragic 5.6% |
| Salvadorans | 1.0 /100 | #241 | Tragic 5.7% |
| Ottawa | 0.9 /100 | #242 | Tragic 5.7% |
| Bangladeshis | 0.8 /100 | #243 | Tragic 5.7% |