Ute vs Brazilian Unemployment Among Ages 45 to 54 years
COMPARE
Ute
Brazilian
Unemployment Among Ages 45 to 54 years
Unemployment Among Ages 45 to 54 years Comparison
Ute
Brazilians
6.2%
UNEMPLOYMENT AMONG AGES 45 TO 54 YEARS
0.0/ 100
METRIC RATING
326th/ 347
METRIC RANK
4.6%
UNEMPLOYMENT AMONG AGES 45 TO 54 YEARS
20.1/ 100
METRIC RATING
199th/ 347
METRIC RANK
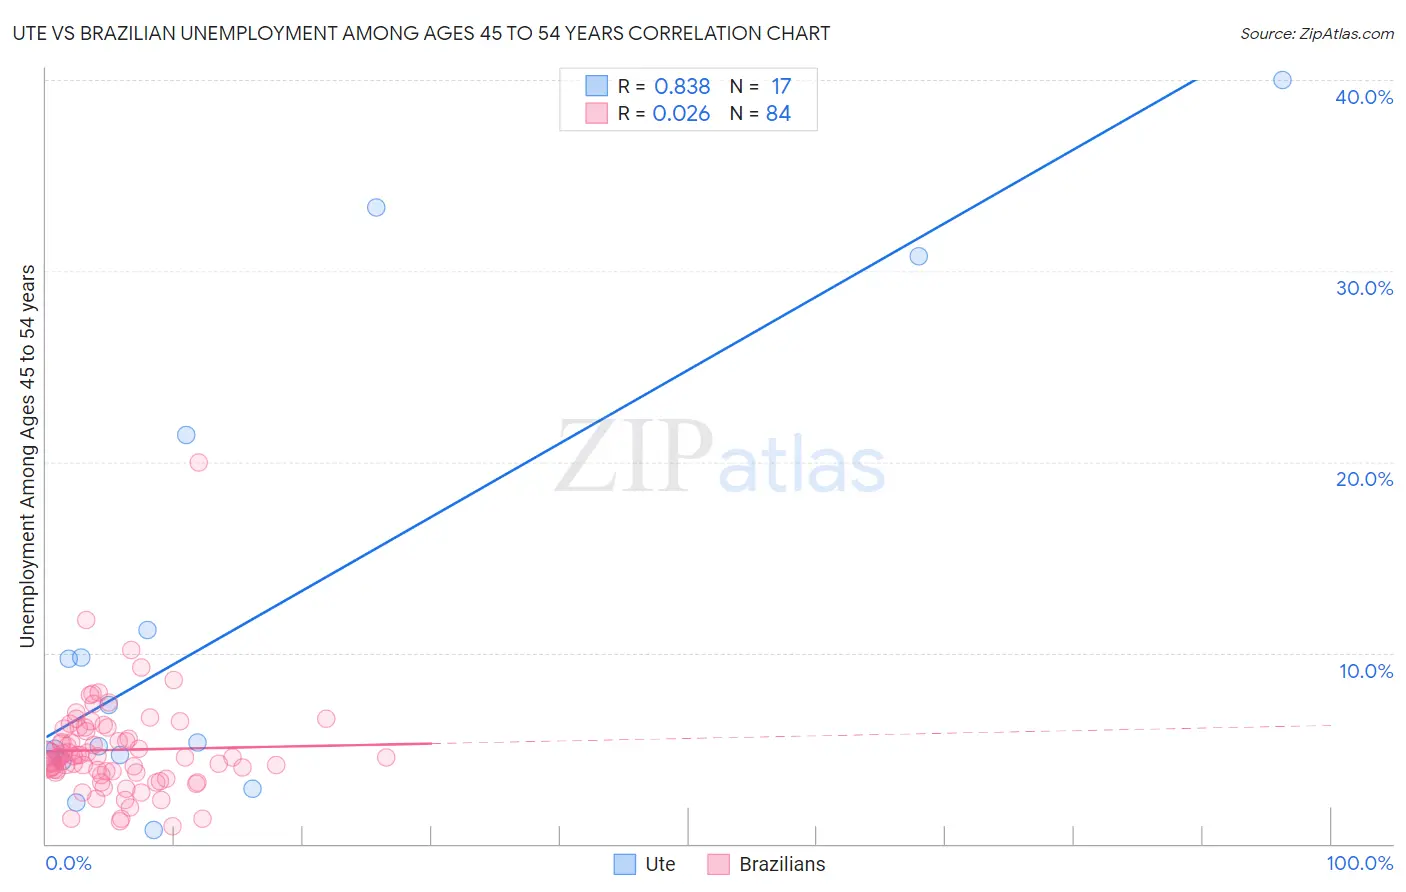
Ute vs Brazilian Unemployment Among Ages 45 to 54 years Correlation Chart
The statistical analysis conducted on geographies consisting of 55,276,716 people shows a very strong positive correlation between the proportion of Ute and unemployment rate among population between the ages 45 and 54 in the United States with a correlation coefficient (R) of 0.838 and weighted average of 6.2%. Similarly, the statistical analysis conducted on geographies consisting of 318,130,578 people shows no correlation between the proportion of Brazilians and unemployment rate among population between the ages 45 and 54 in the United States with a correlation coefficient (R) of 0.026 and weighted average of 4.6%, a difference of 34.7%.
Unemployment Among Ages 45 to 54 years Correlation Summary
| Measurement | Ute | Brazilian |
| Minimum | 0.70% | 0.90% |
| Maximum | 40.0% | 20.0% |
| Range | 39.3% | 19.1% |
| Mean | 11.7% | 4.9% |
| Median | 5.3% | 4.5% |
| Interquartile 25% (IQ1) | 4.5% | 3.7% |
| Interquartile 75% (IQ3) | 16.3% | 6.1% |
| Interquartile Range (IQR) | 11.8% | 2.3% |
| Standard Deviation (Sample) | 12.1% | 2.6% |
| Standard Deviation (Population) | 11.7% | 2.6% |
Similar Demographics by Unemployment Among Ages 45 to 54 years
Demographics Similar to Ute by Unemployment Among Ages 45 to 54 years
In terms of unemployment among ages 45 to 54 years, the demographic groups most similar to Ute are Dominican (6.2%, a difference of 0.21%), Pueblo (6.2%, a difference of 0.42%), Immigrants from Armenia (6.1%, a difference of 0.84%), Alaska Native (6.3%, a difference of 1.1%), and Immigrants from Dominican Republic (6.3%, a difference of 1.3%).
| Demographics | Rating | Rank | Unemployment Among Ages 45 to 54 years |
| Cape Verdeans | 0.0 /100 | #319 | Tragic 5.7% |
| Immigrants | St. Vincent and the Grenadines | 0.0 /100 | #320 | Tragic 5.7% |
| Yakama | 0.0 /100 | #321 | Tragic 5.7% |
| Immigrants | Azores | 0.0 /100 | #322 | Tragic 5.7% |
| Immigrants | Cabo Verde | 0.0 /100 | #323 | Tragic 5.9% |
| Natives/Alaskans | 0.0 /100 | #324 | Tragic 6.1% |
| Immigrants | Armenia | 0.0 /100 | #325 | Tragic 6.1% |
| Ute | 0.0 /100 | #326 | Tragic 6.2% |
| Dominicans | 0.0 /100 | #327 | Tragic 6.2% |
| Pueblo | 0.0 /100 | #328 | Tragic 6.2% |
| Alaska Natives | 0.0 /100 | #329 | Tragic 6.3% |
| Immigrants | Dominican Republic | 0.0 /100 | #330 | Tragic 6.3% |
| Tohono O'odham | 0.0 /100 | #331 | Tragic 6.3% |
| Pima | 0.0 /100 | #332 | Tragic 6.4% |
| Immigrants | Yemen | 0.0 /100 | #333 | Tragic 6.5% |
Demographics Similar to Brazilians by Unemployment Among Ages 45 to 54 years
In terms of unemployment among ages 45 to 54 years, the demographic groups most similar to Brazilians are Immigrants from Denmark (4.6%, a difference of 0.020%), Immigrants from Costa Rica (4.6%, a difference of 0.030%), Immigrants from Peru (4.6%, a difference of 0.070%), Liberian (4.6%, a difference of 0.10%), and Immigrants from Morocco (4.6%, a difference of 0.25%).
| Demographics | Rating | Rank | Unemployment Among Ages 45 to 54 years |
| Immigrants | Thailand | 34.1 /100 | #192 | Fair 4.6% |
| Immigrants | Lithuania | 33.2 /100 | #193 | Fair 4.6% |
| South Americans | 32.9 /100 | #194 | Fair 4.6% |
| Peruvians | 31.5 /100 | #195 | Fair 4.6% |
| Estonians | 31.2 /100 | #196 | Fair 4.6% |
| Albanians | 31.1 /100 | #197 | Fair 4.6% |
| Immigrants | Belarus | 30.6 /100 | #198 | Fair 4.6% |
| Brazilians | 20.1 /100 | #199 | Fair 4.6% |
| Immigrants | Denmark | 19.8 /100 | #200 | Poor 4.6% |
| Immigrants | Costa Rica | 19.7 /100 | #201 | Poor 4.6% |
| Immigrants | Peru | 19.1 /100 | #202 | Poor 4.6% |
| Liberians | 18.7 /100 | #203 | Poor 4.6% |
| Immigrants | Morocco | 16.8 /100 | #204 | Poor 4.6% |
| Immigrants | Greece | 16.2 /100 | #205 | Poor 4.6% |
| Immigrants | Switzerland | 14.0 /100 | #206 | Poor 4.6% |